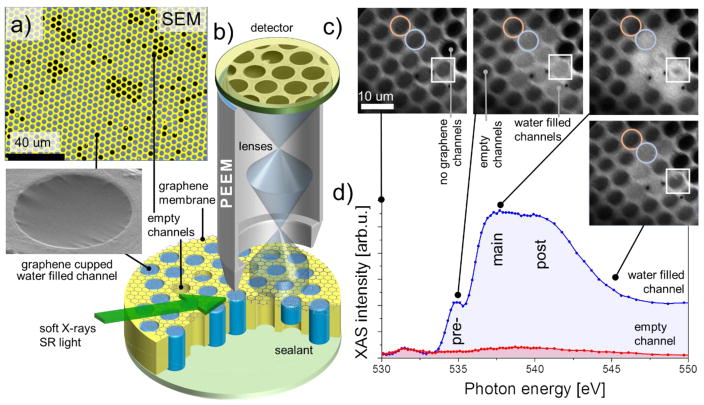
Figure 1. Multichannel array sample design and experimental setup.
a, SEM (5 keV, color coded) image of water filled graphene capped microchannel sample; the darker channels correspond to the graphene capped but empty channels. Inset: water filled 4 microns wide channel (SEM, 2 keV); b, The schematics of the PEEM and liquid cell setups; c, PEEM images of the water filled MCA collected at different X-ray energies while crossing the O K-edge; d, The resultant XAS spectra collected from different ROIs: water-filled (blue circle and spectrum) and empty (red circle and spectrum) channels. White squares mark the channels that exhibit the dynamic behavior. The spectra were normalized to incident X-ray intensity.

