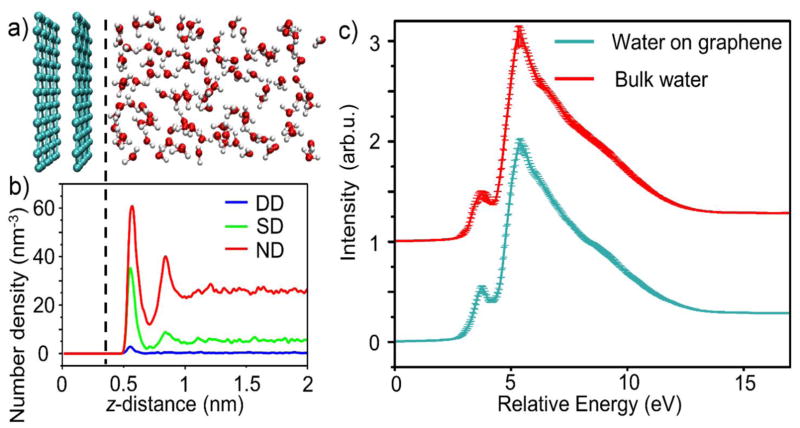
Figure 2. Water structure, hydrogen bonding, and theoretical XAS spectrum.
a, A snapshot of the bilayer graphene-capped water channel from the MD simulations. The simulation is periodic in all directions with the full unit cell shown in Fig. S1a. b, Density of water molecules with differing numbers of hydrogen bonds they donate (DD=double donor, SD=single donor, and ND=non-donor) versus distance from the graphene sheet. a and b share the same z-axis scale and alignment. The graphene induces a density oscillation in the water, as well as a change in the relative population of different donating species. c, The oxygen K-edge XAS spectrum for water at the graphene interface (green) and the spectrum for bulk water (red) as a function of excitation energy. The bulk water spectrum was y-offset for clarity. The presence of graphene does not significantly affect the spectrum of water. This is due to the weak graphene-water interaction: The graphene surface reduces the number of hydrogen bonds, but does not otherwise align water molecules at the surface. Moreover, the core-hole screening by the BLG is not strong enough to suppress the pre-edge peak (as it does with gold). Thus, this peak, as well as the relative location of the main peak are the same for bulk water and water at the graphene interface. The error bars of the XAS curves denote the variance of the mean across different MD snapshots.

