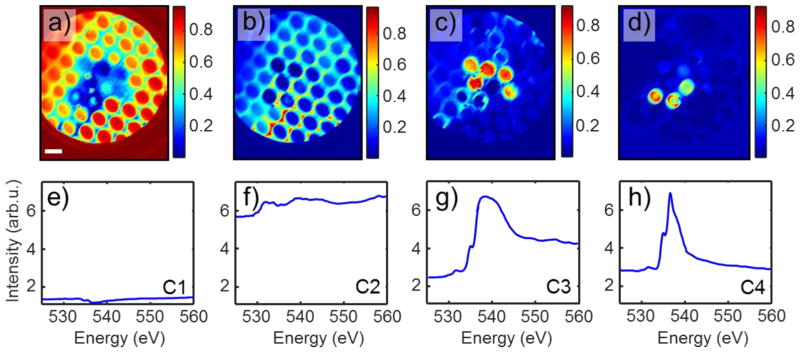
Figure 3. BLU of a PEEM spectroscopic dataset into 4 components.
Component 1 - panels a & e empty channels and the frame of the FOV; Component 2 - panels b & f MCA surface; Component 3 - panels c & g water-filled static channels; and Component 4 - panels d & h water-filled dynamic channels. Abundance maps (component intensity as a fraction of unity) and corresponding endmember spectra are shown. The scale bar is 10 μm. Spectra are displayed on the same scale for comparison. Note, that the irradiation intensity was not uniform throughout the sample, the lower left corner being illuminated less than the upper right (cf. panels a & b).

