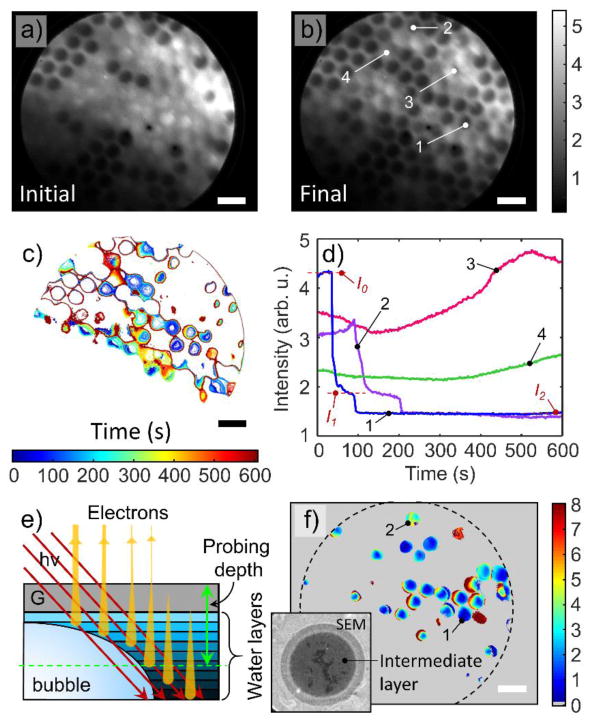
Figure 4. Spatiotemporal PEEM data analysis.
a& b PEEM intensity maps (in arb.u.) of an MCA graphene capped device as recorded in the initial state and 605 s later at an excitation energy of 540 eV. The temporal behavior of the PEEM signal from the channels can be subdivided into three categories: decreasing XAS intensity, increasing intensity and constant signal intensity. c, Contour plot map of the time at which the signal intensity reached a value of 2.2 arb.u. showing how the signal drop started at the cell cores and expanded radially outwards. d, Intensity vs. time curves averaged over the central region (500 nm × 500 nm) of channels indicated in panel b) and displaying representative behaviors. The decrease in intensity proceeds discretely via formation of steps, until the signal reaches the level of empty channels. The last step is most prominent and is clearly visible for channels 1 and 2. Channels 3 and 4 display fluctuation and increase in intensity that reflect dynamic processes taking place in them. e, A schematic of the water-graphene interface model: synchrotron radiation penetrates through the graphene membrane (G) deep into the liquid water, generating photoelectrons, secondary and Auger electrons. Low and intermediate energy electrons become significantly attenuated by cumulative BLG and water layers. Only the fastest electrons with E ≈ 500 eV and IMFP λw = 2.5 nm (few water layers) contribute to the TEY PEEM signal. f, Map of the number of water monolayers that correspond to step I1 (panel d) as estimated from the water-graphene interface model. Dashed circle represents the FOV. Channels 1 and 2 are the same as in panel b. Inset: 5 μm × 5 μm screenshot of the SEM movie (2 keV primary energy, in-lens secondary electron detector) of bubble formation inside the water-filled channel at the graphene-water interface. A peripheral multilayer thick liquid water rim surrounds the metastable intermediate I1 layer. Darkest areas correspond to the appeared patches of clean graphene; The scale bars in all images are 10 μm.

