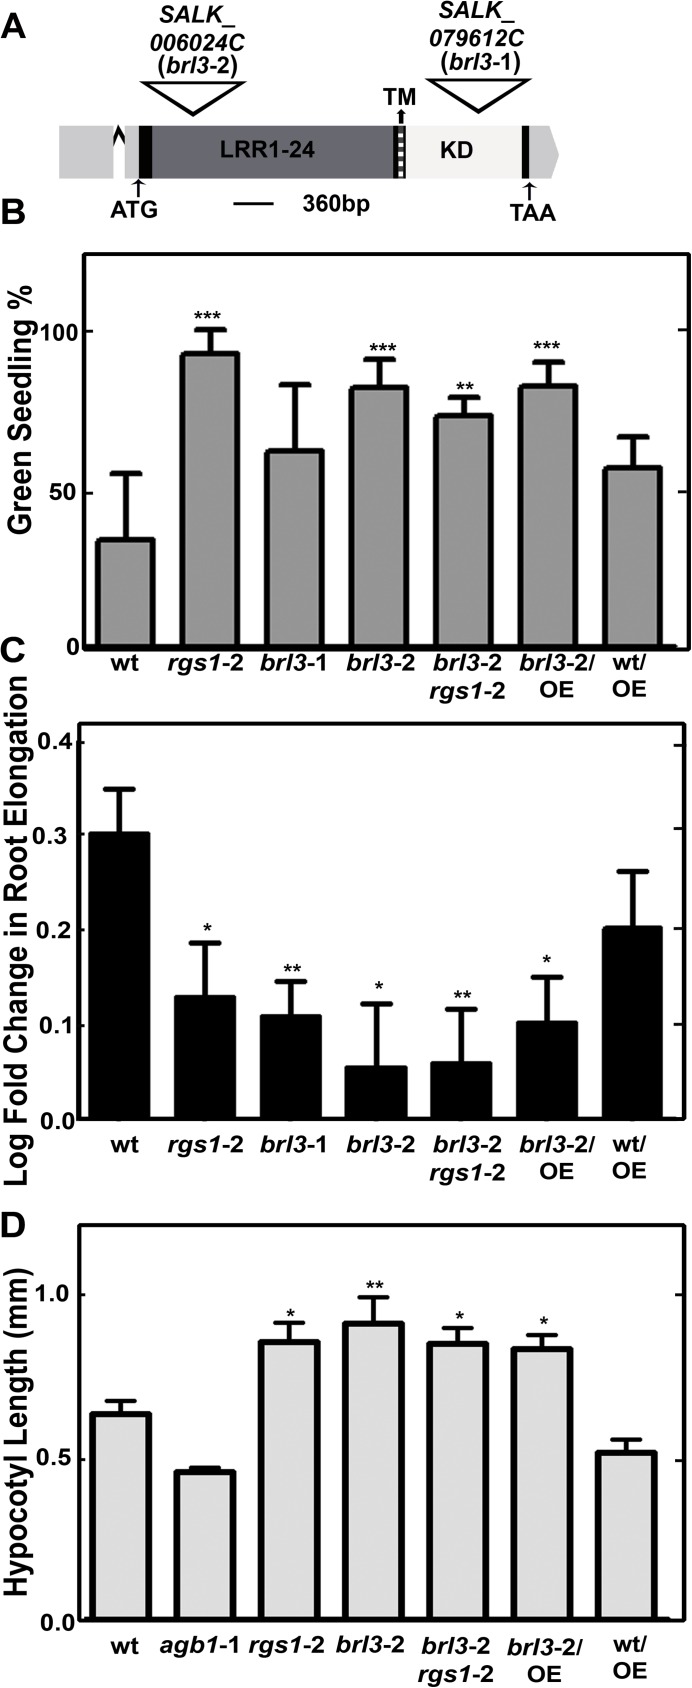
Fig 2. BRL3 and AtRGS1 controls glucose responses.
(A) T-DNA insertion position in brl3-1 and brl3-2 on the 4367-bp-gene model of BRL3 (http://www.arabidopsis.org/). Regions encoding 24 predicted leucine-rich repeats (LRR), transmembrane (TM, dark gray region) and kinase domains (KD, indicated in white) are labeled accordingly. The 5’ and 3’ UTRs are highlighted in light gray and the single intron is indicated with a carat (^). Both T-DNA insertions are in the single exon. (B) BRL3 is required for glucose perception. % of green cotyledons of 8-day-old Arabidopsis seedlings grown on ¼ MS media with 6% glucose under continuous dim-light (20–40 μEinstein/m2/s). The averages are from 4 biological replicates with 8 to 30 seedlings for each genotype. Error bars represent standard deviations. One-way ANOVA followed by Tukey tests were used to compare each genotype to wildtype (wt) (**, *** P value < 0.001, 0.0001) (C) BRL3 and AtRGS1 regulate root growth elengation response induced by high glucose. Log-transformed fold change in root growth of Arabidopsis seedlings grown on ¼ MS media with 6% glucose at continuous dim light between the 4th and 5th day. This experiment (n = 30 to 100) was repeated three times with similar results. Images were captured and ImageJ was used to quantitate lengths OE means overexpression of AtRGS1 in the indicated wild type (Col-0) or brl3-2 mutant. Student’s t-test was used to compare each genotype to wt (*, ** P value < 0.05, 0.01). (D) Seedlings were grown on ½ × MS plates with 1% sucrose for 2 d in darkness. Length of hypocotyls was measured and quantified by image J. Data are mean ± SEM. One-way ANOVA followed by Tukey tests were used to compare each genotype to wt (*, ** P value < 0.05, 0.001).

