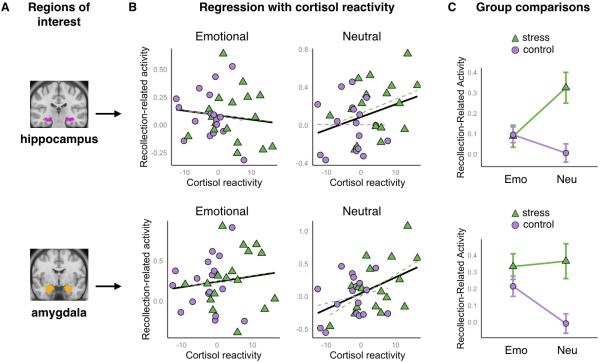
Figure 2. Effects of post-encoding stress on recollection-related activity in the hippocampus and amygdala.
A) Estimates for recollection-related activity (subsequently recollected – missed trials) were obtained for anatomical regions of interest (ROIs) for the hippocampus and amygdala, shown here on an MNI template. B) Scatterplots show the relationship between individual differences in cortisol reactivity (S2-S1) and recollection-related activity for emotional (left) and neutral (right) items. Participants in the control group are marked with violet circles and participants in the stress group are marked with green triangles. Solid black lines represent best linear fit across all participants, whereas the dotted violet and green lines represent the best linear fit within each group. For the hippocampus (top row), the relationship was stronger for neutral compared to emotionally negative memories. For the amygdala (bottom row), the relationship was significant and did not interact with valence. C) Line plots show average recollection-related activity across participants within the control (violet circles) and stress (green triangles) groups, separately for emotional (Emo) and neutral (Neu) items. For this plot, only stress responders (i.e., stress participants who showed in increase in salivary cortisol, N=13) were included. Error bars denote standard error of the mean.

