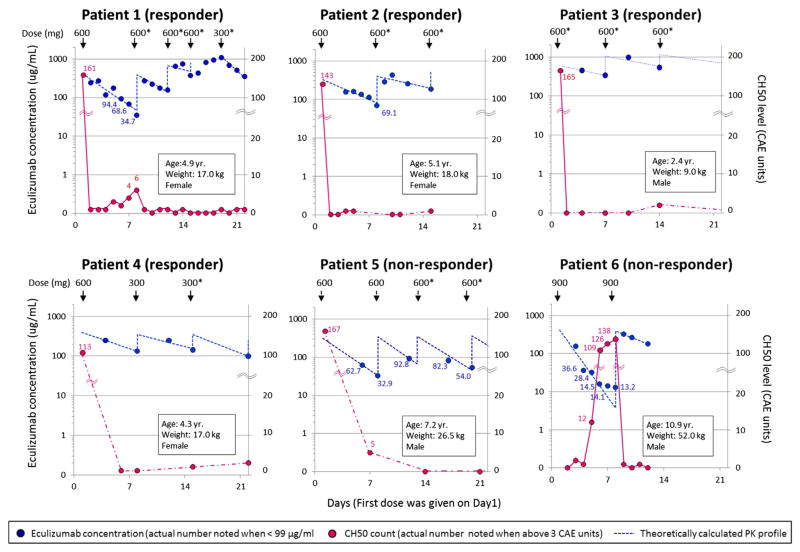
Figure 1.
Pharmacokinetic and pharmacodynamic analyses of eculizumab therapy in 6 patients with HSCT-TMA during the first 3 weeks of treatment are displayed. The left and right y axes show eculizumab concentrations and total complement activity (CH50) levels, respectively. The x axis shows time as days from the start of eculizumab therapy with the first eculizumab dose given on day 1. Dosage (mg) and the timing of administration are indicated with arrows on the top of each figure. Asterisk (*) marks eculizumab doses that are either higher than currently recommended for children with aHUS based on dosing weight or given more frequently [20]. Blue circles represent observed eculizumab concentrations. Actual measured values are noted beside the circles only when eculizumab concentration is below 99 μg/mL. Blue dashed lines represent predicted eculizumab pharmacokinetic profiles based on a 1-compartment analysis (see Methods for detail). Red circles represent the CH50 level. The actual values are listed on the graph only when the CH50 level is above 3 CAE units. Red circles are connected with red solid or dashed lines when measurement of CH50 levels are continuous (daily) or intermittent, respectively. In patient 6, the first 3 measurements days 2, 3, and 4 were used to estimate pharmacokinetic parameters (kel, CL) because concentrations of eculizumab irregularly showed a bi-exponential decline with very low concentrations at the last 3 measurements on days 5, 6s and 7. The Vd for this patient was calculated based on the second treatment.

