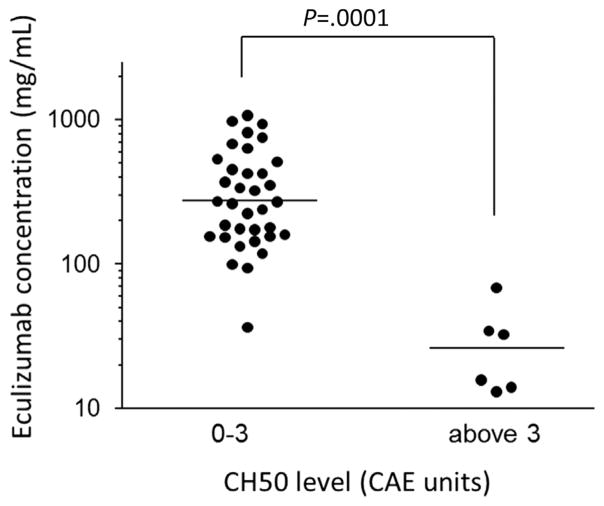
Figure 2.
Relationship between eculizumab concentration and total complement activity (CH50) level. Using the reported therapeutic eculizumab trough cut-off level of >99 or ≤99 μg/mL, the receiver operating characteristic curve and Youden’s Index were used to determine the optimal CH50 cut-off level of 3.5 CAE units. The y axis shows eculizumab concentrations in log-scale. The x axis shows the CH50 level as a group. Horizontal lines represent medians. A CH50 level of 0 to 3 CAE units corresponded with an eculizumab concentration of >99 μg/mL in all except 1 measurement (drawn from patient 6 during an extremely rapid elimination phase in the first week of therapy). Conversely, at all sampling time points, a CH50 level >3 CAE units corresponded with a subtherapeutic level < 99 μg/mL (P = .0001, Mann-Whitney U test).

