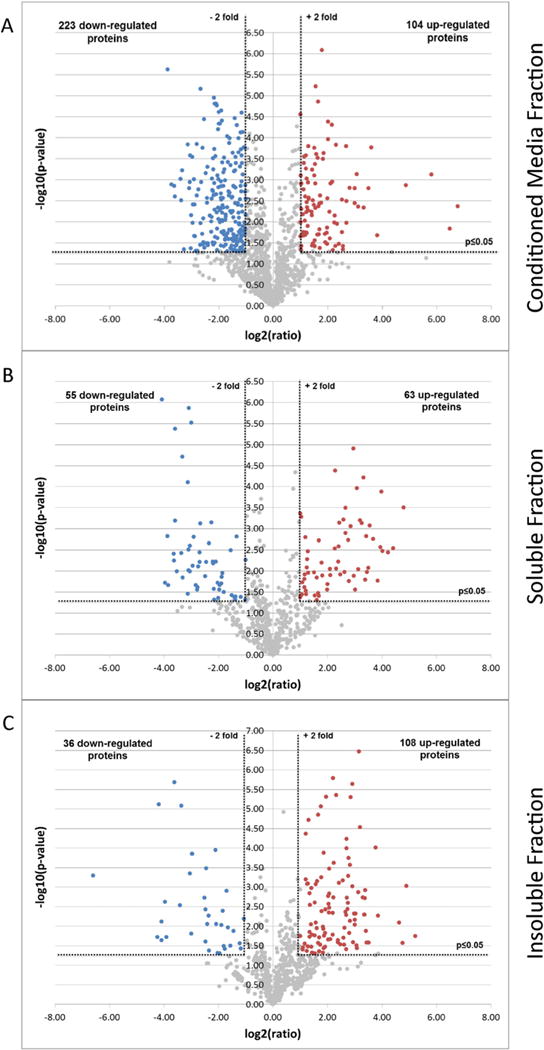
Fig. 2.

Volcano plots illustrate differentially regulated proteins. The quantified proteins in A. Conditioned media fraction, B. Soluble fraction and C. Insoluble fraction were plotted on Volcano graphs — The x-axis represents the log2 (ratio) where ‘ratio’ is the ratio of the averages of LFQ Intensities of GALNT3 KD over control. The y-axis represents the −log10 (p-value) where ‘p-value’ is the p-value associated to the statistical Welch test applied on the three technical replicates of each GALNT3 and control samples. The non-axial vertical dotted lines denote ±2-fold change while the non-axial horizontal line denotes p ≤ 0.05. The colored dots showed proteins considered as up- (red) or down- (blue) regulated, while the non-regulated proteins are display as gray dots.
