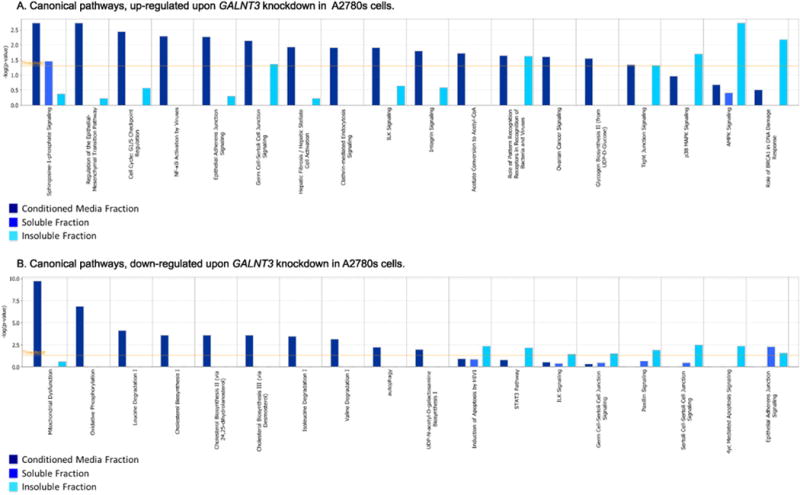
Fig. 5.

Canonical pathway analysis. Canonical pathway analysis for a dataset of differentially expressed genes (≥2-fold; as based on their matched gene symbols) following GALNT3 suppression in A2780s cells, as observed in the three fractions (conditioned media, soluble and insoluble fractions). A. Canonical pathway analysis of up-regulated genes (275); B. Canonical pathway analysis of down-regulated genes (314). Dark blue indicates the conditioned media fraction canonical network gene expression values, light blue indicates the soluble fraction canonical network gene expression values; cyan blue indicates the insoluble fraction canonical network gene expression values. The canonical pathways included in this analysis are shown along the x-axis of the bar chart. The y-axis indicates the statistical significance on the left. Calculated using the right-tailed Fisher exact test, the p-value indicates which biologic annotations are significantly associated with the input molecules relative to all functionally characterized mammalian molecules. The yellow threshold line represents the default significance cutoff at p = 0.05.
