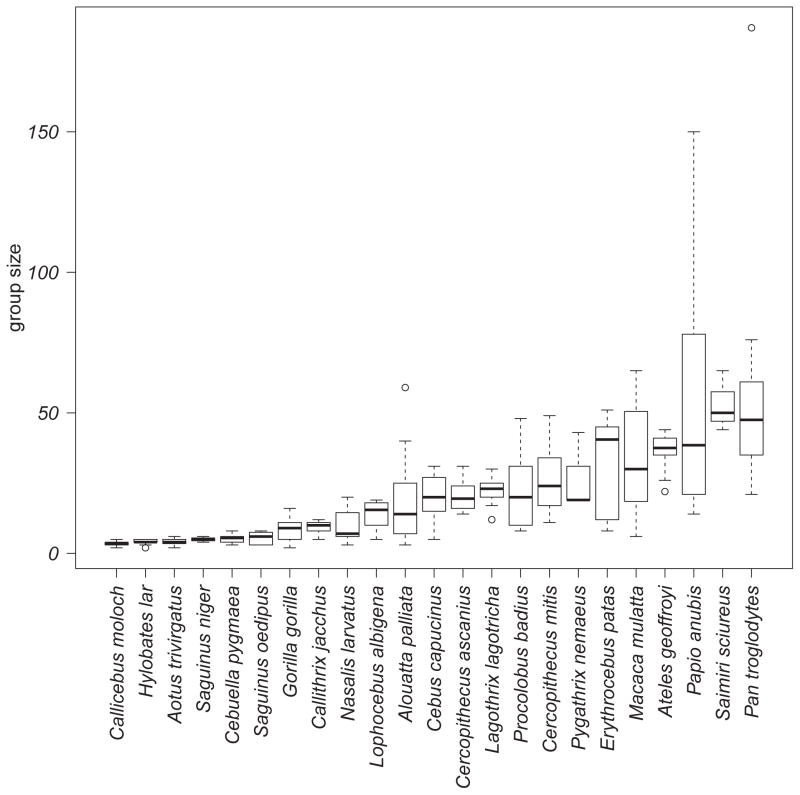
Figure 1.
Within- and between-species variation in group size across sample of 23 primates. The boxplot shows the median and spread of data: the box represents the 25th and 75th percentiles, whiskers represent minimums and maximums relative to the interquartile range, and circles represent outliers.

