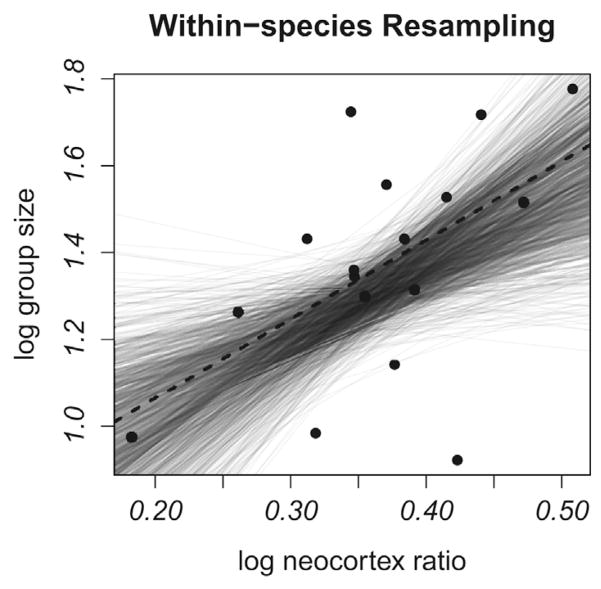
Figure 5.
The relationship between group size and neocortex ratio in a sample of 17 non-monogamous primate species. Results of resampling species-specific group size values with a consensus tree (1000 regressions) are shown. Gray lines = individual regressions, dashed line = regression based on mean group size values and the consensus tree.

