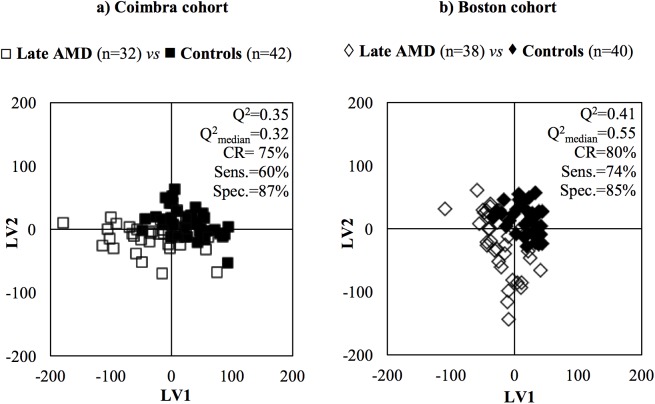
Fig 2. Examples of PLS-DA score plots.
PLS-DA scores scatter plots and MCCV quality parameters (pairwise model Q2, Q2median (obtained through MCCV), % CR, % sens. and % spec.) obtained for variable selected CPMG NMR spectra of late AMD patients vs controls, in the a) Coimbra cohort: late AMD patients (□, n = 32), controls (∎, n = 42) and b) Boston cohort: late AMD patients (◇, n = 38), controls (♦, n = 40).

