
Figure 1.
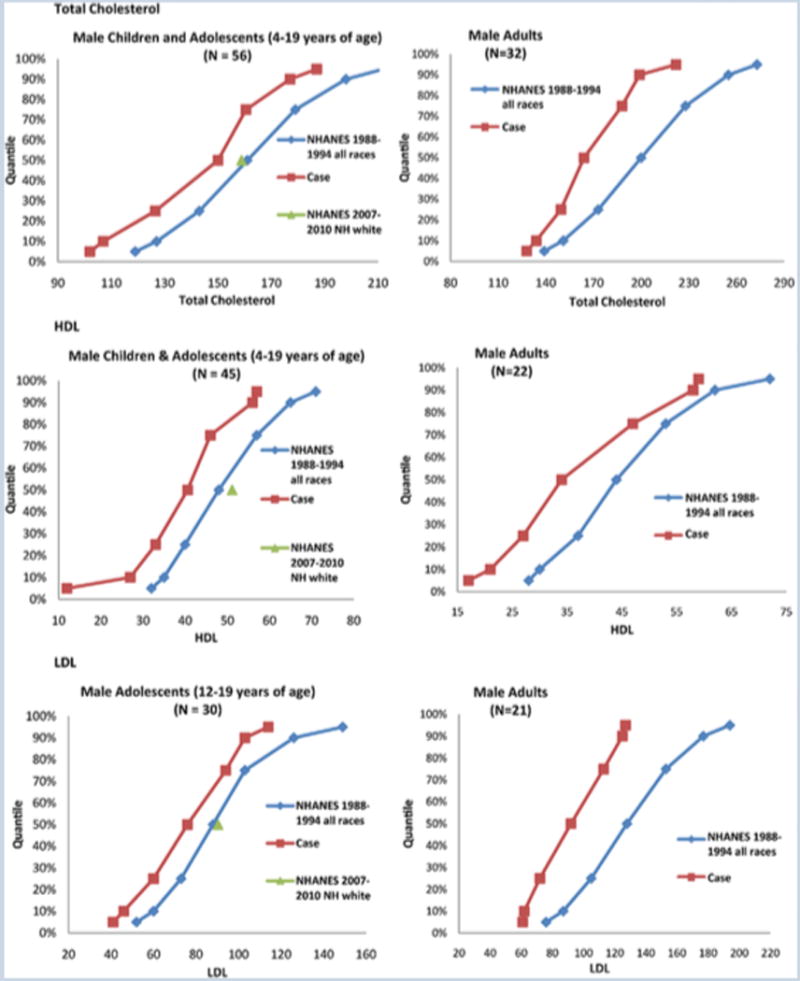
Figures of empirical quantiles (5th, 10th, 25th, 50th,75th,90th,95th) for FXS cases and the general population from the 1988–1994 NHANES cohort for male children/adolescents age 4–19 (left panels) and adults >age 19 (right panels) for total cholesterol (top panels), HDL (middle panels), and LDL (bottom panels). All centile curves were shifted to lower numbers for all lipid levels across all age ranges in patients with FXS. The N value shown in the figure refers to the number of patients with FXS in the cohort and the general population data was taken from Hickman et al. (12) The normal LDL values for children under 12 in the general population were not available so only LDL data from the FXS cohort of patients 12 and over was used for the analysis. The mean values for the 2007–2010 NHANES Caucasian population cohort are shown at the 50%ile for reference on the child/adolescent data plots. This data was not available for adults in the 2007–2010 NHANES published data and thus is only presented in the child/adolescent plots.