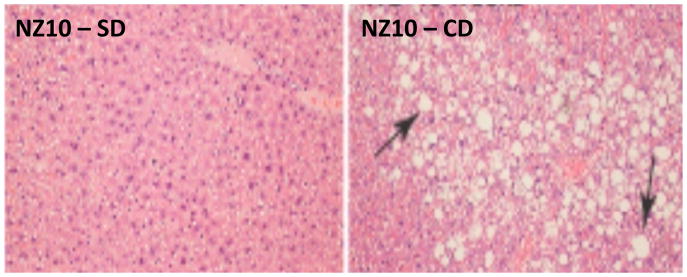
Figure 2. H & E staining of NZ10 liver.
Representative fields of liver sections from NZ10 mice fed HPO (left panel) and CD (right panel) at 25 weeks (representative of n=4). Arrows indicate large fat droplets seen in all CD-fed NZ10 livers that were absent in the HPO groups. There was also evidence of cell necrosis in these regions (not shown).

