
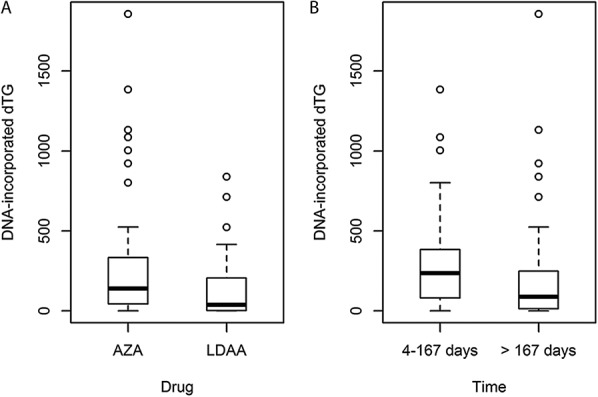
FIGURE 3.
A, Box and whisker plot of data for dTGDNA in the AZA and LDAA treatment groups for all patients in the study and sampled at different periods on therapy. For AZA (all sites) median dTGDNA was 139.6 (mean 241.5, range 0–1857, SD 310.7, n = 97) and for LDAA-treated patients (ESH) 37.6 (mean 128.8, range 0–839.3, SD 184.5, n = 48). For comparison, AZA-treated patients at ESH alone had median dTGDNA 173.1 (mean 308.7, range 0–1384.5, SD 399.4, n = 27). B, Box and whisker plot for dTGDNA in 2 time periods: 4 to 167 days (∼≤ 24 wk) and > 167 days (>24 wk), representing time to achievement of remission, and maintenance of remission.19 Initial assessment of dTGDNA by time periods at 4 to 83, 84 to 167, 168 to 252, or >252 days after initiation of therapy suggested a decrease after 167 days (see Fig. 1, Supplemental Digital Content 1, http://links.lww.com/IBD/B503); therefore, periods 1 and 2, and 3 and 4 were combined for analysis. The distributions of treatment times were similar for AZA and LDAA-treated patients. Units: dTGDNA, moles dTG/106 moles deoxyadenosine.