
Figure 2.
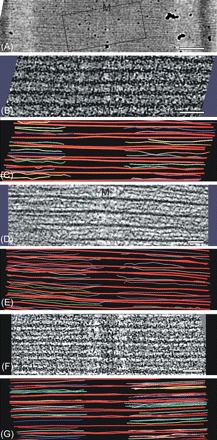
Electron tomography to measure thin filament lengths in rat cardiac, mouse cardiac, and frog skeletal muscle. (A) Electron micrograph of a thin section of rat cardiac (papillary) muscle showing the approximate region used to produce one of the rat muscle tomograms in this study. Using the crossbridge 43 nm periodicity for internal calibration, the sarcomere length was 2.27 µm. M marks the location of the M-band in this figure. (B) An example 2D slice from one of the tomograms of rat papillary muscle. Using Imod, the thick filaments were traced in red and the thin filaments were traced in various colours. The left side and the right side provided two independent sets of data for thin filament measurements. For the filament tracing, the Imod slicer option was used to tilt the tomogram so that particular sets of thin filaments were in the plane of the view. (C) A model produced with Imod of the thin and thick filaments contained in the tomogram for (B). (D) An example 2D slice from the tomogram of mouse papillary muscle. Here, thick and thin filaments are clearer than for the rat tomogram in (B). (E) IMOD model produced from the tomogram of mouse papillary muscle in (D) showing the thick filaments (red) and thin filaments (various colours). (F) An example 2D slice from the tomogram of frog sartorius muscle. (G) Imod model for frog showing thick (red) and thin (various colours) filaments. Scale bars: (A) 0.25 µm, (B, D, F) 100 nm.