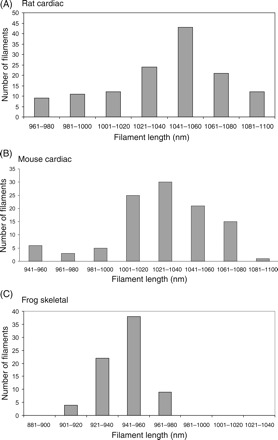
Figure 3.

Distribution of thin filament lengths in (A) rat cardiac papillary, (B) mouse cardiac papillary, and (C) frog skeletal sartorius muscles. Rat and mouse thin filaments have a broad distribution of lengths with a mean of 1.04 and 1.03 µm, respectively, and standard deviation of ∼30 nm. In comparison with cardiac thin filaments, the distribution for skeletal muscle thin filaments (C) is very sharp, and within the experimental error, the thin filaments have uniform lengths of 0.94 nm.
