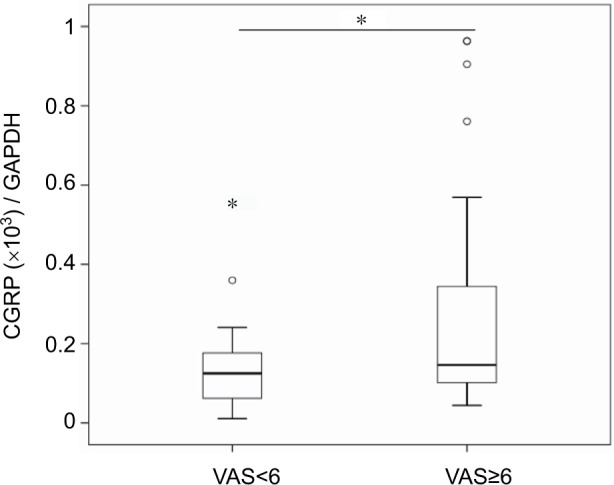
Figure 3.

CGRP expression in OA patients with strong/severe (VAS≥6) and mild/moderate pain (VAS<6).
Notes: Real-time PCR analysis of CGRP expression in synovial tissue of OA patients. Box and Whisker plot for CGRP expression in synovial tissue of OA patients with strong/severe (VAS≥6; n=44) and mild/moderate pain (VAS<6; n=30). The plot shows median (bold horizontal line), IQR (box) and range, with outliers plotted beyond 1.5 times the IQR from the box. *p<0.05.
Abbreviations: CGRP, calcitonin gene-related peptide; OA, osteoarthritis; VAS, visual analog scale; PCR, polymerase chain reaction; IQR, interquartile range.
