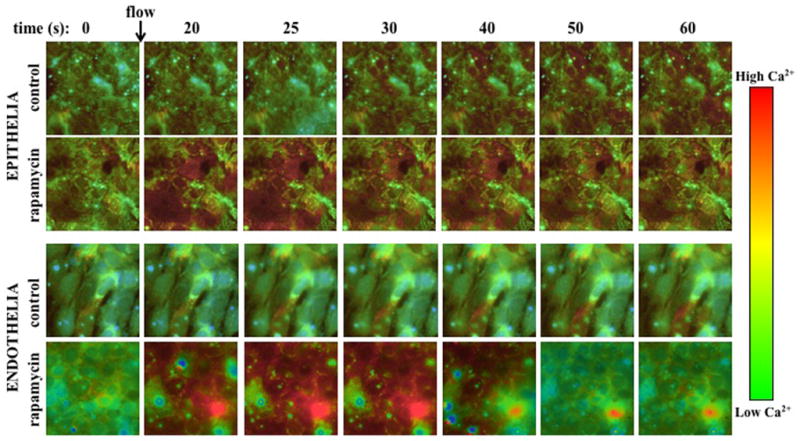
Figure 3. Fluid-shear stress induces calcium influx.

Representative Fura images at different time points from each group are shown, and the arrow indicates the start of fluid flow. Color bars indicate cytosolic calcium levels from low (green) to high (high).
