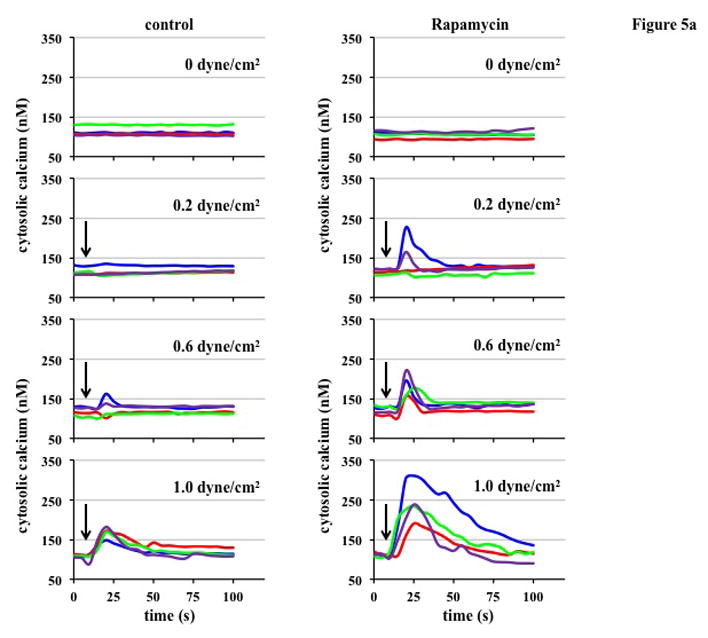
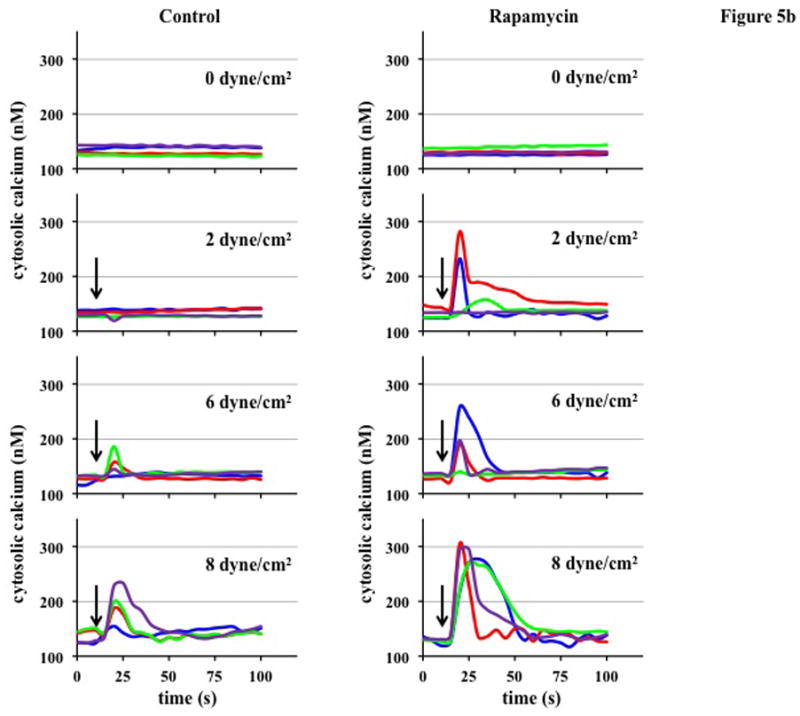
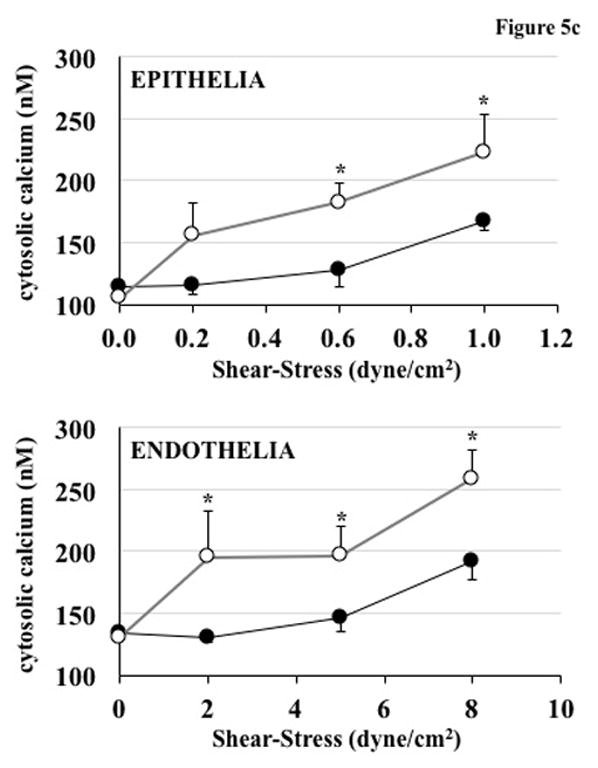
Figure 5. Rapamycin-treated cells show higher calcium influx in response to increasing various shear-stress forces.


In the time-lapse graph, baseline calcium levels were measured, and shear stress was applied at ~10 seconds (arrows). For epithelial cells a physiologically relevant range of 0–1.0 dyne/cm2 was used and for endothelial cells which experience higher ranges maximum shear stress used was 8 dyne/cm2 . (A) In renal epithelial cells, rapamycin treated cells showed higher levels of peak calcium in response to shear stress of varying magnitude. A shear stress of 0.2 dyne/cm2 was enough to cause calcium influx in rapamycin-treated cells. (B) Same effect was observed in vascular endothelial cells where rapamycin treatment increased the shear stress-induced calcium influx compared to control cells. (C) Peak calcium levels are shown on the graph at different levels of shear stress. In epithelial cells, significant increase in calcium influx was observed at shear stress levels ≥0.6 dyne/cm2 in rapamycin-treated vs. control cells. Endothelial cells also show significant increase in calcium influx when exposed to different levels of shear stress. For each calcium measurement, and a total of 4 experiments with N=50 for each was used. * = p<0.05 compared to corresponding controls.
