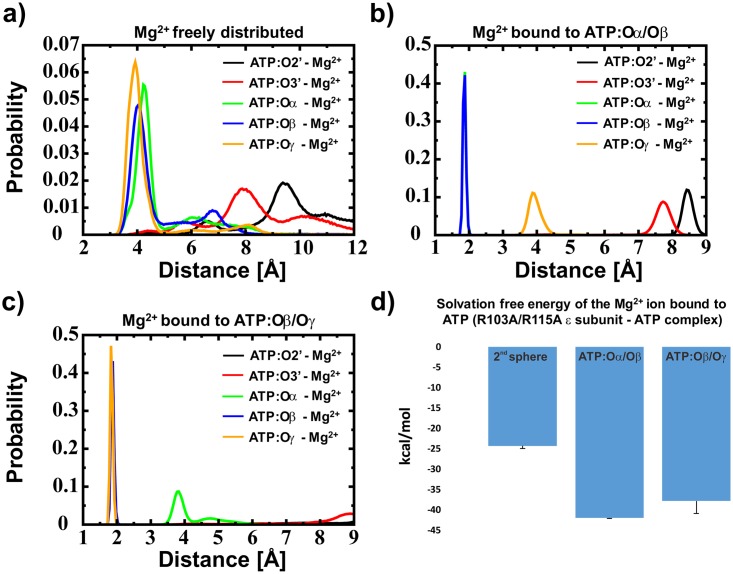
Fig 2. Distance distribution of the Mg2+ ion and free energy results.
Distance distribution when the Mg2+ ion a) is bound in a second sphere coordination to ATP, b) is bound in a first sphere coordination to ATP:Oα/Oβ and c) is bound in a first sphere coordination to ATP:Oβ/Oγ; ATP is bound to the protein in all cases. In a)–c) the black, red, green, blue and orange lines represent the minimal distance distributions of a Mg2+ ion towards ATP:O2’, ATP:O3’, ATP:Oα, ATP:Oβ and ATP:Oγ, respectively. The before mentioned data were extracted from conventional MD simulations. In d) the free energy calculations (Thermodynamic Integration) for the binding of Mg2+ towards ATP in second sphere coordination, when bound to ATP:Oα/Oβ or ATP:Oβ/Oγ are shown, respectively. It should be noted that in Fig b) the blue and the green lines are overlapping.

