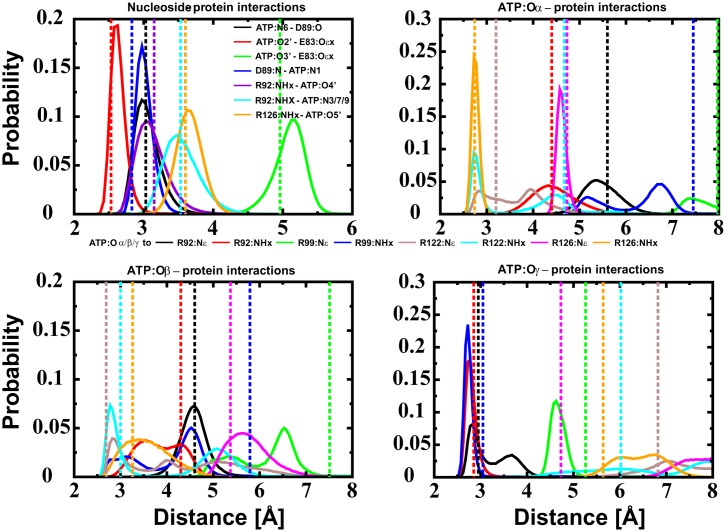
Fig 3. Distance distribution of protein-ATP interactions.
Distance distribution of protein-ATP interactions of the Mg2+ bound to ATP:Oα/Oβ. Dotted lines represent distances found in the crystal structure of the wild type protein. The histogram in the top left represents nucleoside–protein interaction (black: ATP:N6 –D89:O, red: ATP:O2’–E:83:Oεx, green: ATP:O3’–E83:Oεx, blue: D89:N—ATP:N1, violet: R92:NHx—ATPO4’, cyan: R92:NHx—ATP:N3/7/9 and orange: R126:NHx—ATP:O5’). The three other diagrams represent protein—ATP:Oα/β/γ interactions (black: R92:Nε, red: R92:NHx, green: R99:Nε, blue: R99:NHx, brown: R122:Nε, cyan: R122:NHx, magenta: R126:Nε and orange: R126:NHx), respectively. The corresponding figures for the Mg2+ freely distributed state and Mg2+ coordinated to ATP:Oβ/Oγ are shown in S2 and S4 Figs in the Supporting Information, respectively. The corresponding data for the single runs is shown in S5 (Mg2+ not bound in first sphere), S6 (Mg2+ bound to ATP:Oα/Oβ) and S7 Figs (Mg2+ bound to ATP:Oβ/Oγ), respectively.

