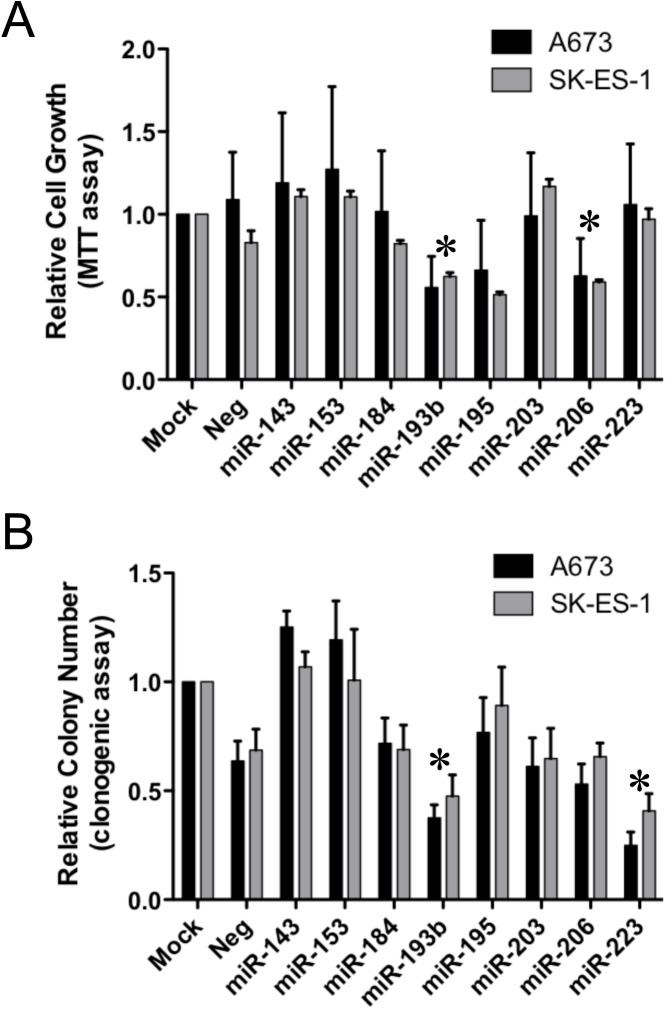
Fig 1. Functional miniscreen for growth suppressive microRNAs in Ewing Sarcoma.
(A) Ewing sarcoma A673 and SK-ES-1 cells were mock transfected, or transfected with the indicated miR or non-targeting negative control mimics at a final concentration of 25 nM. 24 hours later, cells were harvested, counted and plated at 5 x 10³ cells per well in 96-well plates. Relative cell numbers on day 5, normalized to the mock group and plotted as the mean and standard error of the mean (SEM) of 4 independent experiments, each performed in triplicate, are shown. (B) Ewing sarcoma A673 and SK-ES-1 cells were transfected as in “A” and 24 hours later were plated at 500 cells per well in 6-well plates. Colonies were stained with crystal violet 14 days later, and quantified using a Nikon digital image analysis system (NIS-Elements). Results are represented as the mean and SEM of 4 independent experiments, each performed in triplicate, normalized to the mock group. *: p<0.05, in both A673 and SK-ES-1 cells, relative to negative control (“Neg”, which is the average of two different non-targeting negative control mimics).

