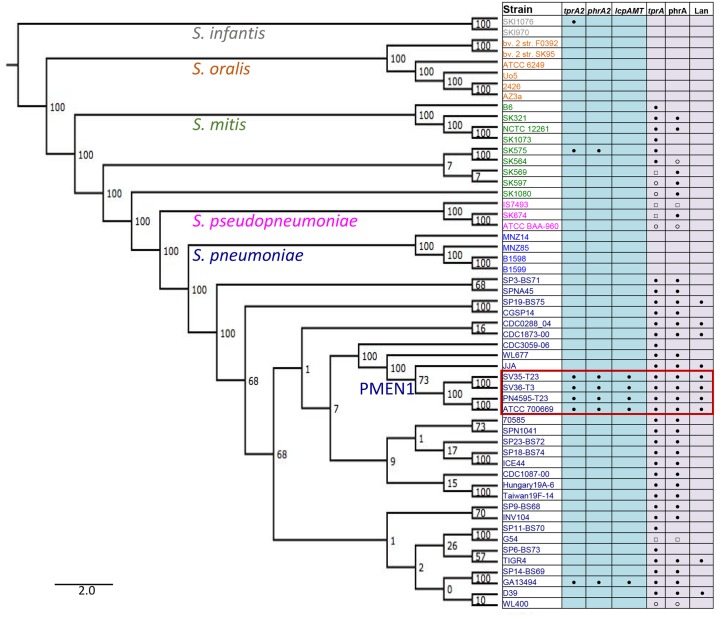
Fig 2. Intra- and inter-species distribution of the TprA2/PhrA2 and TprA/PhrA genomic regions.
Phylogenetic analyses displaying bootstrap values on the branches. Left side: Maximum likelihood tree of streptococcal genomes generated from the core genome. Right side: Gene distribution, where blue columns display the distribution of tprA2, phrA2, and associated lcpAMT, and purple columns display the distribution of tprA, phrA, and downstream lantibiotic genes (seven consecutive genes, including predicted lanA and lanM labeled as Lan). Presence of the gene is marked with the following symbols: ‘●’ gene present in one copy; ‘○’ low coverage of region; ‘□’multiple copies of the gene. Red box indicates isolates from the PMEN1 lineage.

