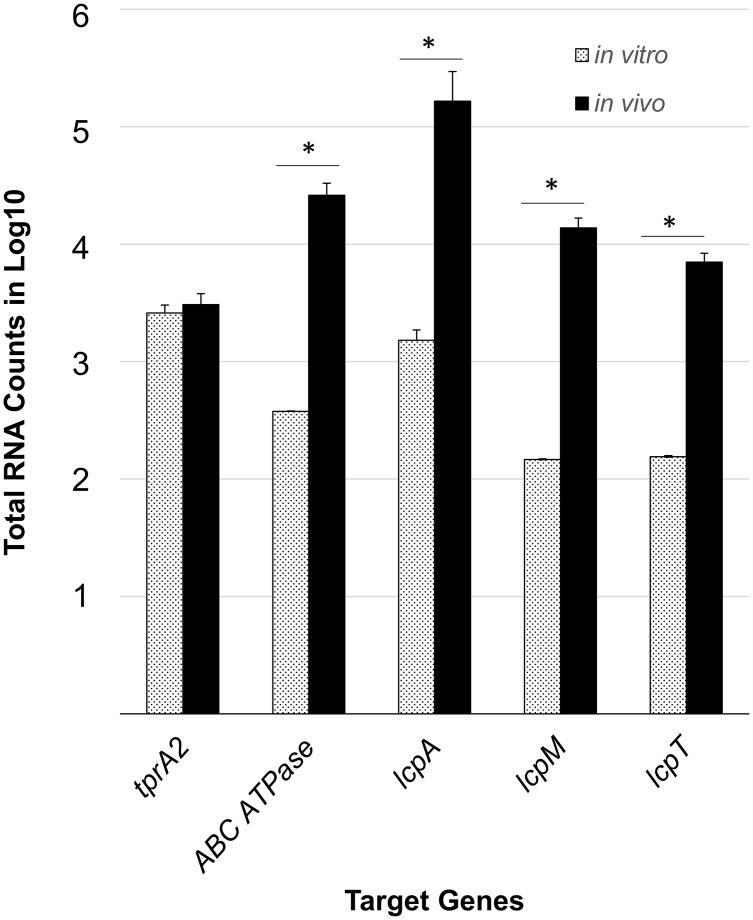
Fig 3. Gene expression levels of the TprA2/PhrA2 system and associated lcpAMT locus in chinchilla middle ear effusions and planktonic cultures.
nCounter nanoString technology was used to quantify mRNA transcripts from planktonic cultures (dotted bars, n = 2) and chinchilla middle ear effusions (black bars, n = 3). Data was normalized to the geometric mean of the expression of gyrB and metG using nSolver software. The X-axis denotes the test genes assayed for gene expression. The Y-axis displays the log10 of the total number of transcripts for each gene averaged over biological replicates. Error bars represent the standard deviation. ‘*’ Significantly higher in vivo expression (P-value < 0.05), as determined by Student’s t-test.

