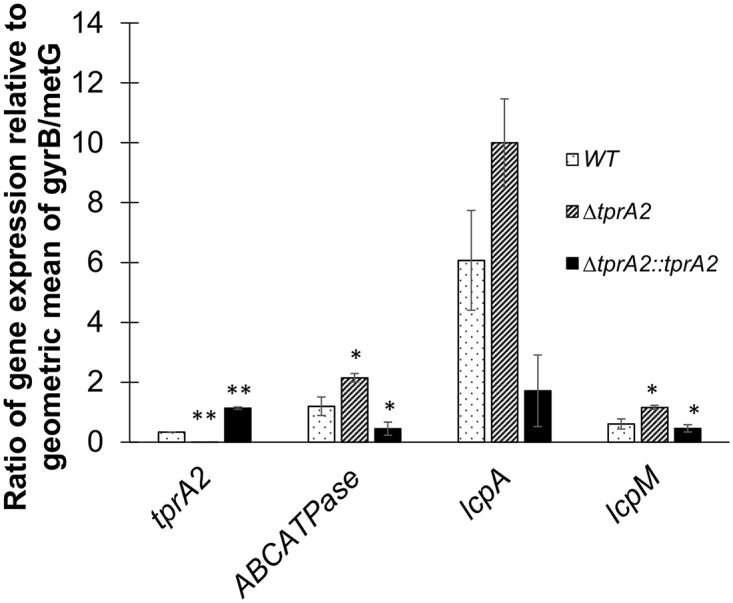
Fig 7. Gene expression of TprA2 regulon in the middle ear.

Bars represent gene expression as measured by nCounter platform by NanoString technology on RNA extracted from middle ear effusions of chinchillas cohorts (n = 3) infected with three different strains: WT (dotted bars), ΔtprA2 (striped bars), and ΔtprA2::tprA2 (black bars) individually. The data is represented as ratios relative to the geometric mean of housekeeping genes gyrB and metG (Y-axis). Target genes are indicated on the X-axis. Error bars represent standard deviations. Statistical significance was determined by Student’s t-test and was calculated with reference to WT in each set of test gene; ‘*’, P-value = <0.05; ‘**’, P-value<0.01.
