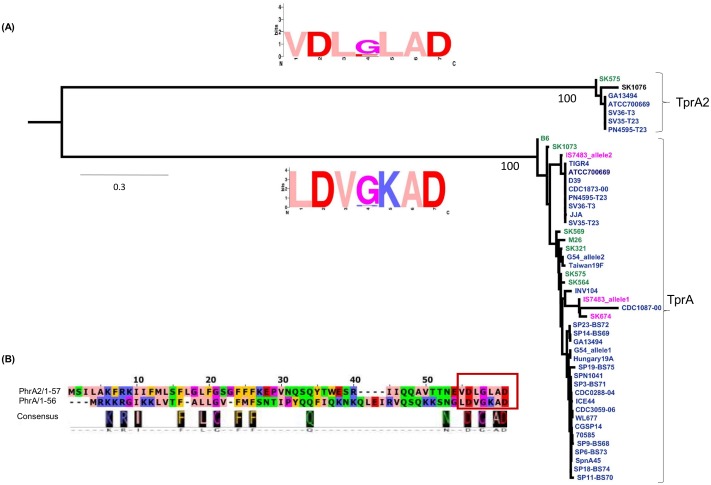
Fig 9. Phylogenetic analysis of separation between TprA2 and TprA systems.
(A) Gene tree generated from the coding sequences for tprA and tprA2 using maximum likelihood. Each branch displays a sequence logo, derived from the predicted C-terminal heptapeptide of PhrA2 (top) and PhrA (bottom). In the logo, amino acids are represented in one letter abbreviation where their height within the stack represents its relative frequency at a given position, in zappo color-coding scheme: blue/positive; red/negative; salmon/hydrophobic; orange/aromatics; purple/glycine or proline; green/hydrophilic. (B) Alignment of predicted coding sequence of PhrA and PhrA2 in PMEN1 strain PN4595-T23. Representation showing alignment (top) and consensus (bottom). Seven amino acids of the C-termini are highlighted in the red box indicating the sequence of synthetic peptides used in this study.

