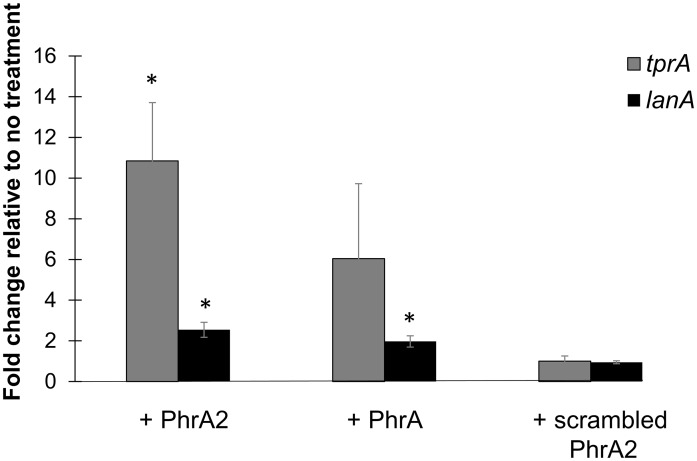
Fig 11. PhrA2 influences the gene expression levels of the TprA/PhrA system in non-PMEN1 strain D39.
qRT-PCR measurements of gene expression for target genes performed in strain D39ΔphrA upon treatments indicated on the X-axis. Data was normalized to levels of 16S rRNA. The Y-axis reflects the fold change in the treatment group relative to the no treatment control. Treatments correspond to: (i) PhrA2 C-terminal heptapeptide (VDLGLAD); (ii) PhrA C-terminal heptapeptide (LDVGKAD); or (iii) scrambled peptide (DAGVLDL). Target genes correspond to tprA regulator (gray bar), and its associated lanA gene (black bar). Error bars represent standard deviations for biological replicates (n = 3), * Statistically significant difference in gene expression compared to scrambled peptide (P-value<0.01).

