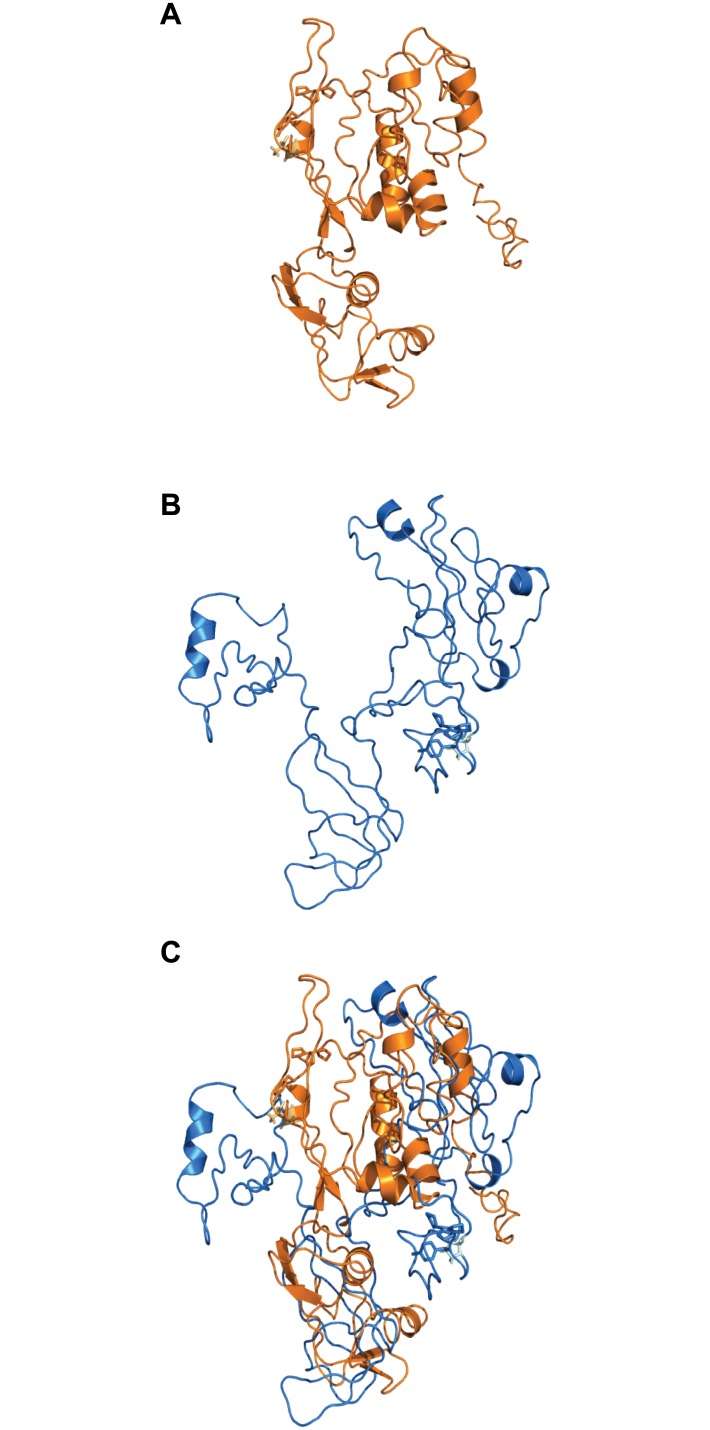
Fig 3. Models of the three-dimensional structure of WBP1.
A: variant T, corresponding to the major allele; B: variant P corresponding to the minor allele; C: Superimposed models of both isoforms of the protein. In each panel, the light color side chains represent the position of the AA affected by the SNP.

