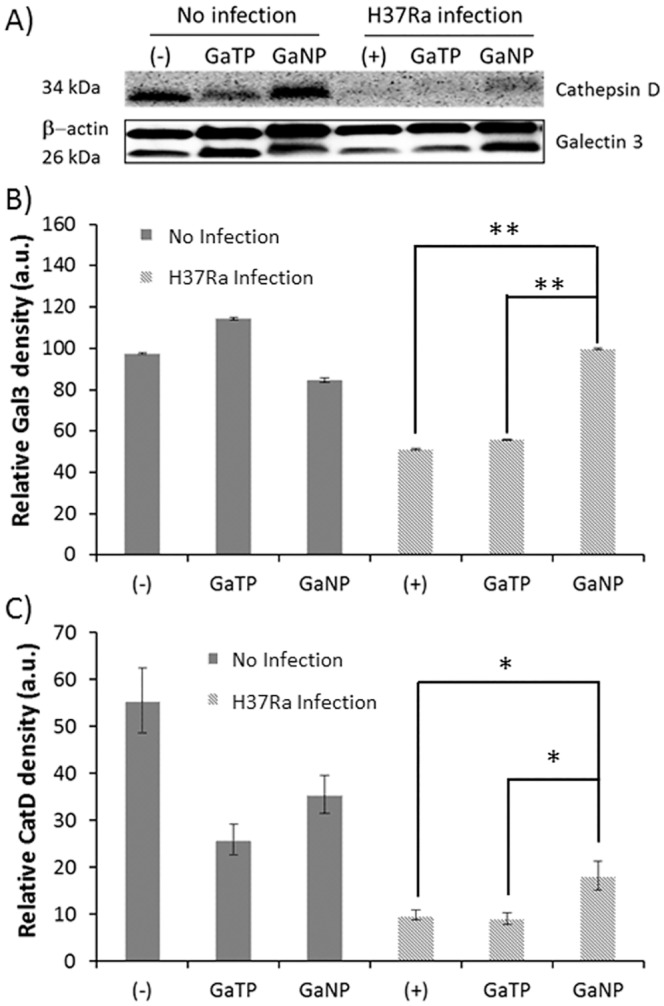
Fig 6. Expression of cathepsin D and galectin 3 in MDMs.

MDMs treated with drugs were infected with H37Ra for 4 h (MOI = 1), following which the cells were lysed and levels of cathepsin D and galectin 3 were determined by immunoblot and quantitated by densitometry. Data represent the mean ± SEM of triplicate samples (n = 3). Statistical differences were determined using Student’s t test: *p < 0.05, **p<0.01 compared with non-drug treated (+) control.
