
Figure 4.
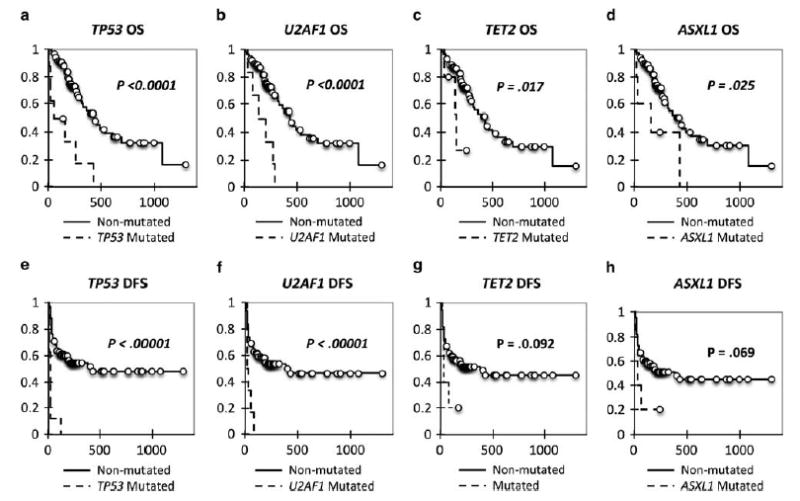
Kaplan–Meier curves for TP53, U2AF1, and TET2. (a) Overall survival (OS) Kaplan–Meier curve for TP53. (b) OS Kaplan–Meier curve for U2AF1. (c) OS Kaplan–Meier curve for TET2. (d) OS Kaplan–Meier curve for ASXL1. (e) Disease-free survival (DFS) Kaplan–Meier curve for TP53. (f) DFS Kaplan–Meier curve for U2AF1. (g) DFS Kaplan–Meier curve for TET2. (h) DFS Kaplan–Meier curve for ASXL1.