
Figure 3.
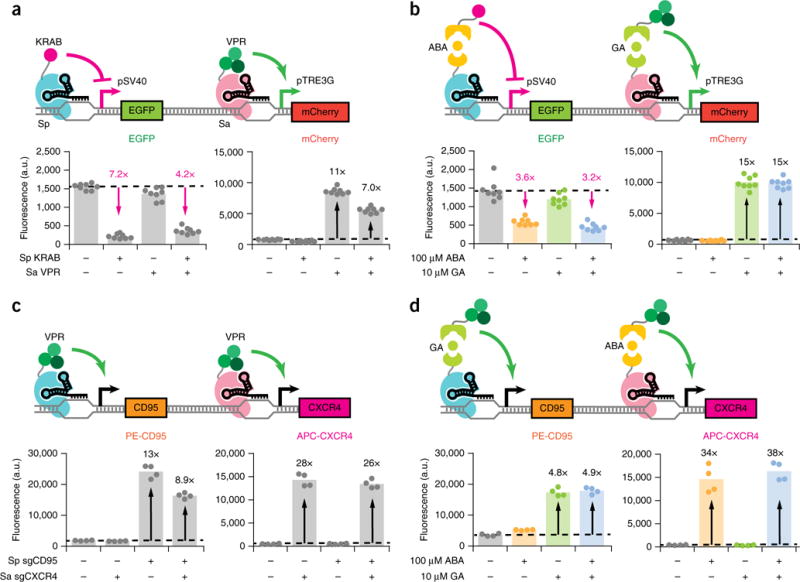
Orthogonal gene regulation by independently inducible dCas9s. (a,b) Fluorescence quantifications for HEK293T pSV40-EGFP pTRE3G-mCherry dual reporter cells transfected with (a) direct fusion KRAB-Sp dCas9 and/or VPR-Sa dCas9 plus their respective sgRNAs or (b) ABA-inducible KRAB–Sp dCas9, GA-inducible VPR–Sa dCas9, and their respective sgRNAs. EGFP fluorescence is displayed for quantifications performed after 5 d induction, and mCherry fluorescence is displayed for quantifications performed after 48 h induction. Fold-change activation is indicated in black, while inverse fold-change repression is indicated in magenta. The data represent four independent transfections performed in technical replicates (n = 8). Dots represent individual data points. The different colors represent different treatment conditions: gray, no inducer; yellow, ABA; green, GA; blue, both ABA and GA. (c,d) Immunofluorescence quantifications for CXCR4 and CD95 after 48 h induction for HEK293T cells transiently transfected with (c) direct fusion KRAB–Sp dCas9, VPR–Sa dCas9, and sgRNAs or (d) GA-inducible VPR–Sp dCas9, ABA-inducible VPR–Sa dCas9, and sgRNAs and stained with APC-conjugated CXCR4 and PE-conjugated CD95 antibodies. Transfected sgRNAs consisted of three targeting sgRNAs (Sp sgCD95-1 to 3 or Sa sgCXCR4-1 to 3) per gene of interest or an equimolar amount of nontargeting sgRNA (Sp/Sa sgTRE3G). The data represent four independent transfections (n = 4). P values from Games-Howell post hoc tests following Welch’s ANOVA are provided in supplementary Table 1.