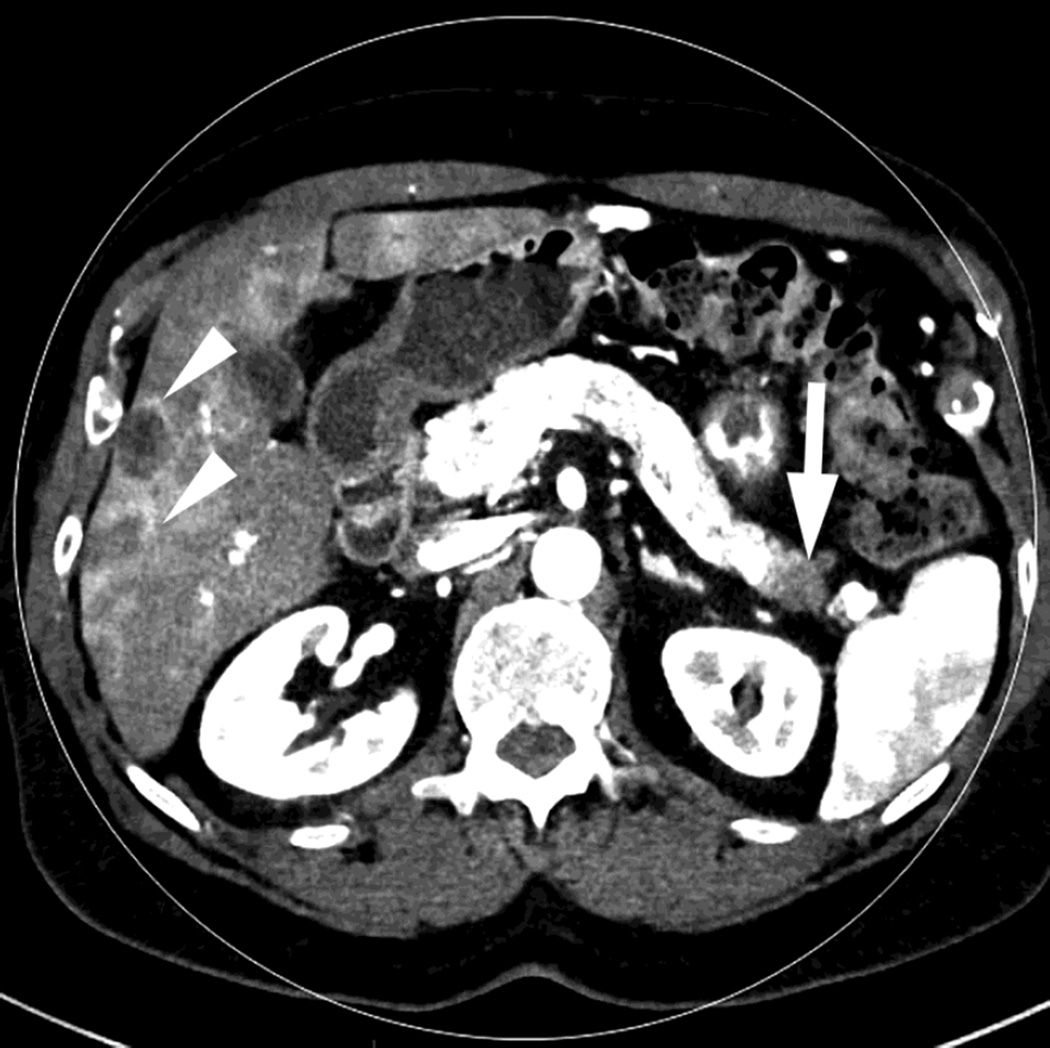
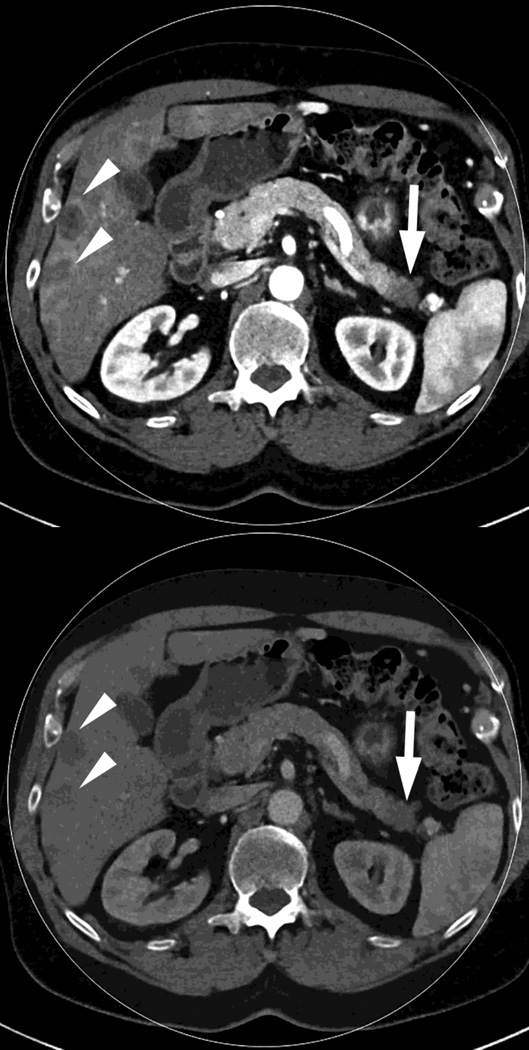
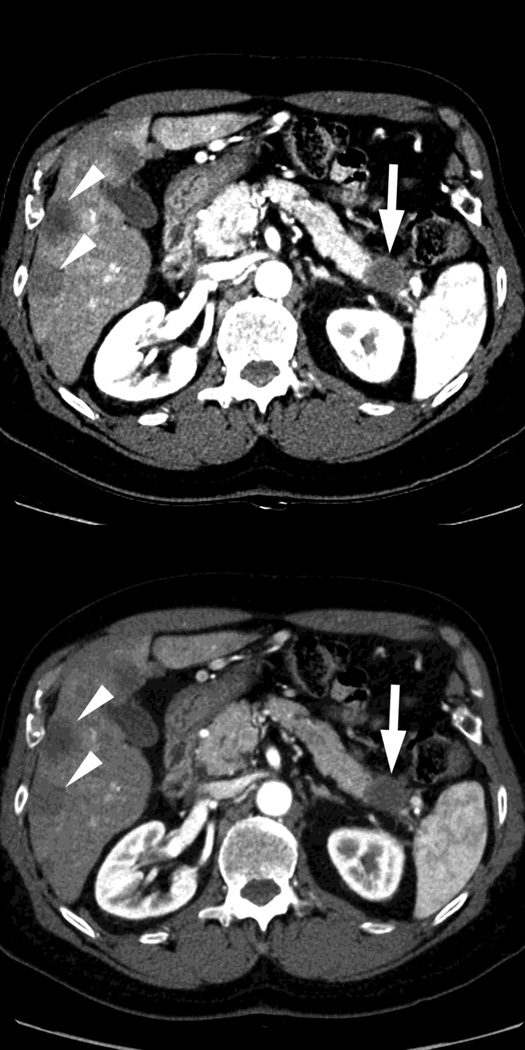
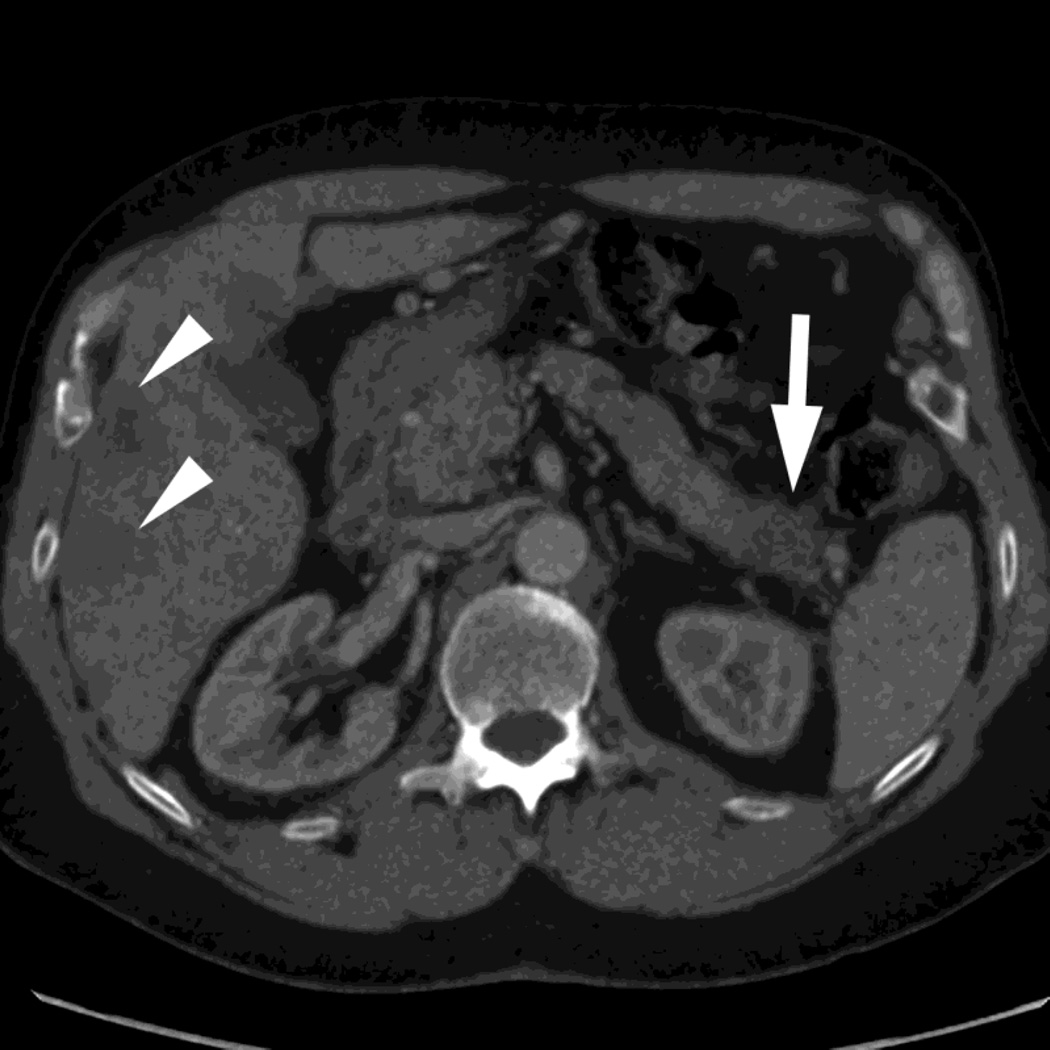
Fig. 2.
Monochromatic energy images from same patient, imaged 2 months apart, as in Figure 1, for DSDECT, "Mono + algorithm," (A–C) and RSDECT (D–F) at 50 kev (A,D), 70 kev (B,E), and 140 keV (C,F). Images are all at the same window setting. Pancreatic tail tumor (white arrow) and liver metastases (white arrowheads). Enhancement becomes more conspicuous at lower keV. Note the difference in enhancement between the pancreatic tail tumor and adjacent pancreas..


