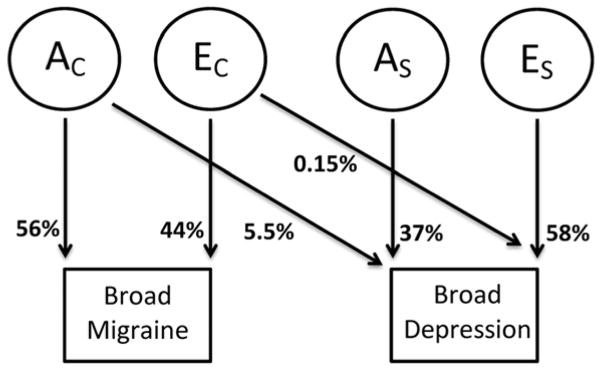
Figure 1.
Path diagrams of the bivariate Cholesky models for broad diagnoses. The square frame represents the observed trait and the circle frame represents the latent variable. AC and EC stand for the additive genetic variable and unique environmental variable common to migraine and depression; AS and ES stand for the additive genetic variable and unique environmental variable specific to depression.

