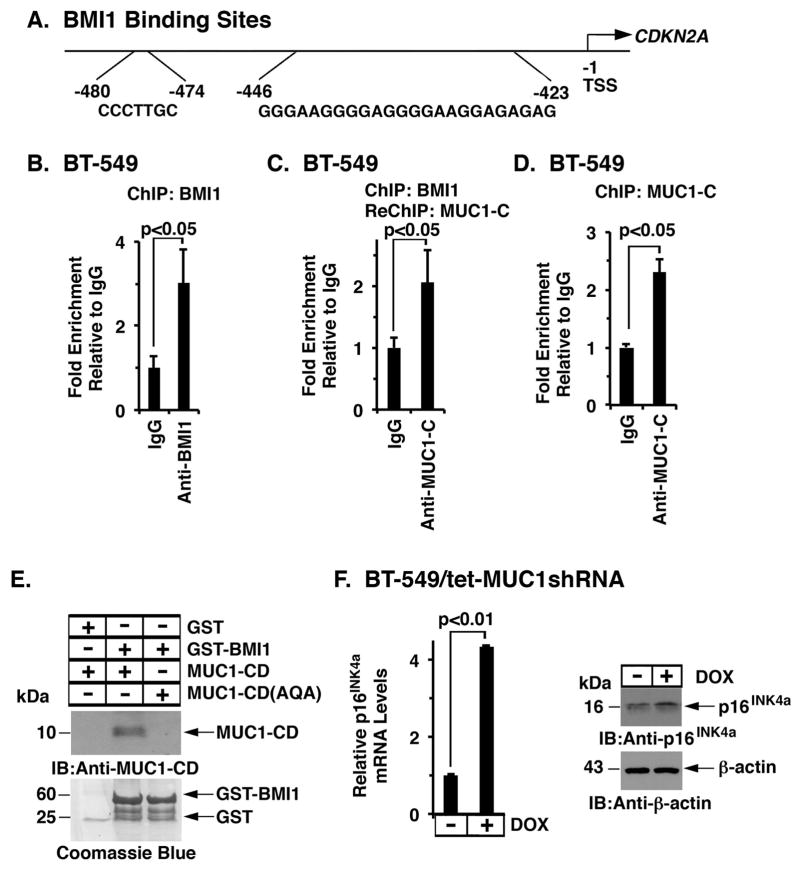
Figure 6. MUC1-C/BMI1 complexes occupy the CDKN2A promoter.
A. Schema of the CDKN2A promoter with positioning of the BMI1-response element (BRE) at −423 to −446 and −474 to −480 bp upstream to the transcription start site. B. Soluble chromatin from BT−549 cells was precipitated with anti-BMI1 or a control IgG. C. In the re-ChIP analysis, BMI1 precipitates were released and re-immunoprecipitated with anti-MUC1-C and a control IgG. D. Soluble chromatin from BT-549 cells was precipitated with anti-MUC1-C or a control IgG. The final DNA samples were amplified by qPCR with primers for the CDKN2A promoter. The results (mean±SD of three determinations) are expressed as the relative fold enrichment compared with that obtained with the IgG control (assigned a value of 1). E. GST and GST-BMI1 were incubated with either purified MUC1-CD or MUC1-CD(AQA). The adsorbates were immunoblotted with anti-MUC1-C. Input of the GST proteins was assessed by Coomassie blue staining. F. BT-549/tet-MUC1shRNA cells were treated with or without DOX for 7 d. p16INK4a mRNA levels were determined by qRT-PCR. The results (mean±SD) are expressed as relative p16INK4a mRNA levels compared to that obtained for control DOX-untreated cells (assigned a value of 1) (left). Cell lysates cultured with or without DOX for 12 d were immunoblotted with the indicated antibodies (right).

