Figure 1.
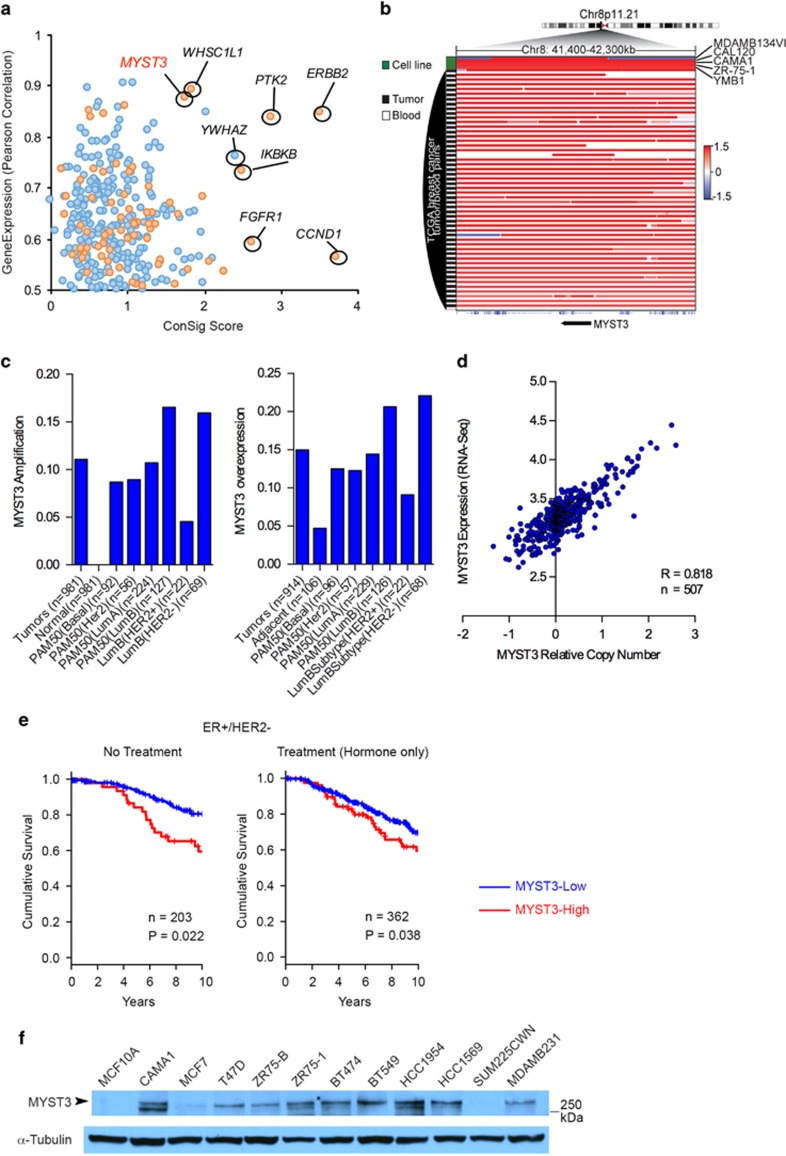
MYST3 is amplified and overexpressed in breast cancer. (a) MYST3 is nominated as a potential druggable oncogene target in breast cancer by integrative bioinformatics analysis. We used the Affymetrix SNP 6.0 copy number and Agilent 4502A gene expression data sets for invasive breast cancer from TCGA (http://cancergenome.nih.gov/). Normalized ‘level 3' data segmented by the CBS algorithm were applied in the analysis.13 First, genes that are recurrently amplified in more than 10% of invasive breast tumors were nominated and their expressions correlated with copy number using Spearman's correlation statistics (R>0.5 as cutoff). The druggability of these genes was predicted according to several drug-target databases.14, 15, 16 Then, all candidates were ranked by Pearson's correlation coefficient, and by the concept signature (ConSig) score that we have developed.5 This score prioritizes biologically important genes underlying cancer by accessing their strength of association with molecular concepts characteristic of cancer genes (see http://consig.cagenome.org, release 2). The overexpression cutoff is based on median+1 × MAD (median absolute deviation). MAD is calculated using the R with default constant (1.4826). (b) Amplification of MYST3 locus in breast cancer cell lines (data from Broad-Novartis Cancer Cell Line Encyclopedia), breast tumors, and blood (data from TCGA). (c) MYST3 is amplified and overexpressed in breast tumors based on TCGA breast cancer copy number and RNAseq data sets. Luminal B subtype has the highest overexpression rate. (d) The correlation of MYST3 overexpression in breast tumors based on the TCGA RNAseq data set, with its corresponding gene copy number. R value is based on Pearson's correlation. The relative copy number was estimated by dividing the tumor signal intensities with signal intensities from the linear combination of all normal samples that are most similar to the tumor, which were then transformed with log2. (e) MYST3-high predicts worse survival outcome for ER+/HER2− breast patients. Both systematically untreated (n=203) or hormone treated (n=362) ER+/HER2− breast cancer patients showed worse clinical outcome in MYST3-high groups. Survival analyses results based on the cutoff of median+MAD (data from METABRIC provided by Molecular Taxonomy of Breast Cancer International Consortium (Illumina HT-12 v3)). MAD is calculated using the R with default constant (1.4826). Normalized gene expression data matrixes were used for survival analysis. The available probe for MYST3 in the Illumina HT-12 v3 array is ILMN_2095840. Patients were divided into two groups (MYST3-high and the rest), according to the cutoff based on median+1 × MAD. MAD is calculated using the R with default constant (1.4826). Kaplan–Meier analyses were carried out using the R survival package. Follow-up time was limited to a maximum of 10 years. P-values were calculated according to the log-rank test. (f) MYST3 protein expression in a subset of breast cancer cells. MCF7, T47D, CAMA1, ZR75-B and ZR75-1 cells were obtained from Dr Rachel Schiff. SK-BR-3, BT474, HCC1569, HCC1954, BT549 and MDA-MB-231 were obtained from American Type Culture Collection (ATCC). LY2 was cultured as described.40 SUM225CWN was purchased from Asterand Bioscience (Detroit, MI, USA). MCF7, ZR75-1, ZR75-B, BT474, T47D, HCC1569, HCC1954 and BT549 cells were cultured in RPMI 1640 (Cellgro, Manassas, VA, USA) with 10% fetal bovine serum and 200 mg/ml l-glutamine (Life Technologies, Carlsbad, CA, USA). CAMA1, SK-BR-3 and MDA-MB-231 cells were cultured in DMEM (Thermo Fisher Scientific, Waltham, MA, USA) with 10% fetal bovine serum and 200 mg/ml l-glutamine (Life Technologies). MCF10A cells were cultured as described.41 The protein levels were determined with western blot. Cells were homogenized in RIPA Lysis Buffer (50 mm Tris·HCl pH8.0, 150 mm NaCl, 2 mm EDTA, 1% NP-40, 0.5% sodium deoxycholate, 0.1% SDS), supplemented with HALT (Thermo Fisher Scientific). Forty micrograms of protein extracts were heated in sample buffer at 70 °C, separated by Tris-Acetate protein gels (NuPAGE Novex 3-8% Gels, Life Technologies), and transferred onto a nitrocellulose membrane (Bio-Rad, Hercules, CA). The membranes were blocked for one hour and incubated overnight at 4 °C with either anti-MYST3 rabbit polyclonal (1:2000, Active Motif, #39867), or with anti-alpha Tubulin monoclonal (1:5000, Sigma, #T5168) antibodies. Membranes were then incubated with horseradish peroxidase-conjugated secondary antibody (Life Technologies) and the signals were visualized by the enhanced chemiluminescence system (Perkin Elmer, Waltham, MA, USA) as per the manufacturer's instructions.

