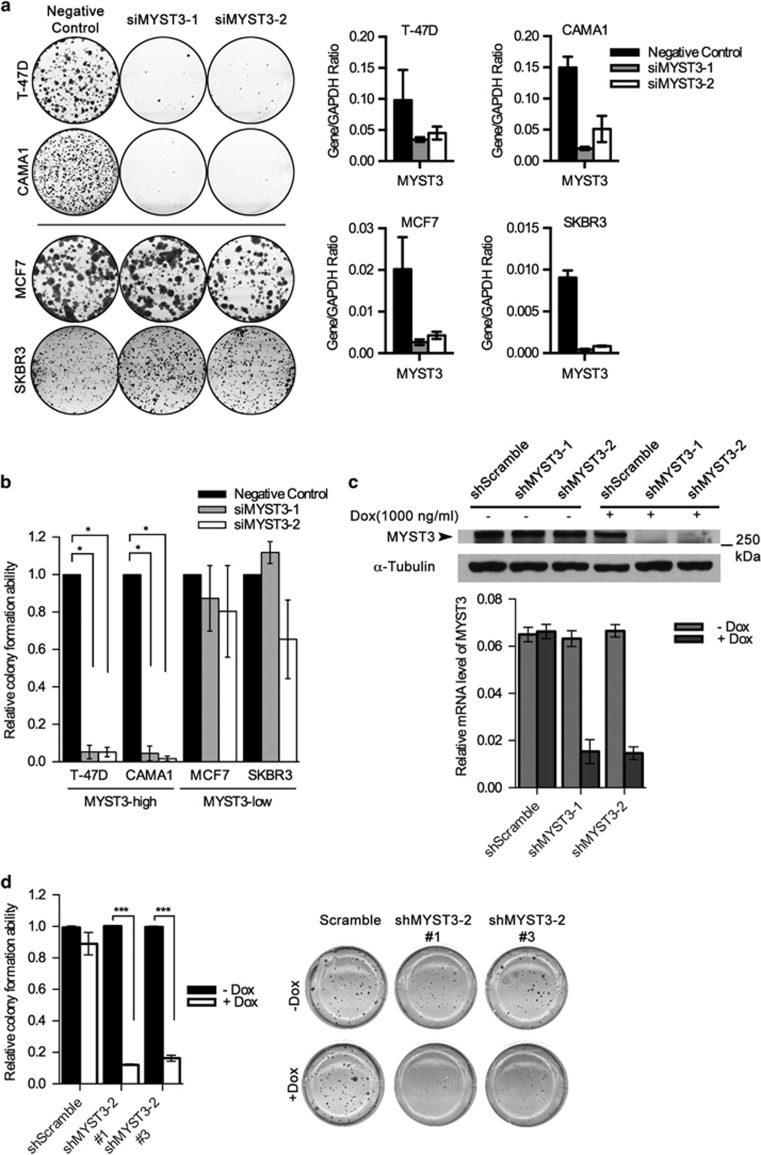
Figure 2.
Knocking down MYST3 inhibits cell growth in ER+, MYST3-high breast cancer cells. (a) Clonogenic assay: MYST3-high (T47D and CAMA1) and MYST3-low (MCF7 and SKBR3) breast cancer cells were plated at a density of 500 cells/well in a 6-well plate, and treated with two MYST3-specific siRNAs (siRNA1: 5′-GCGCUAUACUAAUCCAAUA-3′ and siRNA2: 5′-GGAGUUGAGUGUUAAAGAU-3′) and negative control siRNA (Qiagen, Valencia, CA, USA) to knockdown MYST3. siRNAs were transfected using Lipofectamine RNAi MAX Reagent (Life Technologies) according to the manufacturer's protocol. Transfected cells were incubated for 2–3 weeks. The colonies were stained with 0.5% crystal violet in 50% methanol and counted. Statistical data are presented as mean±s.d. Three experiments were performed. (b) MYST3-high (T47D and CAMA1) and MYST3-low (MCF7 and SKBR3) breast cancer cells were infected with shRNAs against MYST3 (shMYST3-1: 5′-TTGGAGTTGAGTGTTAAAGAT-3′ shMYST3-2: 5′-CGGCGCTATACTAATCCAATA-3′) and non-silencing controls (5′-GCGAAAGATGATAAGCTAA-3′). Control and shRNA oligos were annealed and cloned into the inducible lentiviral vector pLKO-Tet-On (Addgene plasmid 21915). Lentiviral vector mixed with packing plasmid (psPAX2) and envelope plasmid (pMD2g) were transfected into 293T cells using Lipofectamine 3000 (Life Technologies). Viral supernatants were collected after 48 h. The stable lines expressing shMYST3 were selected with Puromycin (Life Technologies). Doxycycline (Dox) (Sigma-Aldrich, St. Louis, MO) was used for the induction of shMYST3 for 2–3 weeks. Statistical data are presented as mean±s.d, P-values were calculated based on two-tailed student's t-test. Three experiments were performed. (c) Protein and mRNA levels of MYST3 in T47D cells after induction of shMYST3 by 500 ng/ml Dox. The protein levels were determined with western blot. Total RNA from all samples was isolated with the RNeasy Mini Plus Kit (Qiagen) according to the manufacturer's protocol. Complementary DNA was synthesized from 1μg total RNA, using a Transcriptor First Strand cDNA Synthesis Kit (Roche Diagnostics, Indianapolis, IN) in the presence of random primers. All oligonucleotide primers used in this study were synthesized by Integrated DNA Technologies (Coralville, IA, USA). MYST3 qPCR primers are: forward: 5′- ATAATCCTGGGCGAATAGCACT-3′ reverse: 5′- CTGCCTCCGAATAATGCAGAC-3′. Quantative Real-Time PCR (qRT–PCR) was performed on Applied Biosystems ViiA 7 (Life Technologies). The relative expression level of each target gene was determined using the comparative threshold cycle (Ct) method and normalized to a housekeeping gene, glyceraldehyde-3-phosphate dehydrogenase (GAPDH). Statistical data are presented as mean±s.d. P-values were calculated based on two-tailed student's t-test. Three experiments were performed. (d) Soft agar assay: relative colony formation ability of MYST3-high T47D breast cancer cells after treatment with inducible MYST3 shRNAs. The soft agar assay was performed as described previously. Briefly, T47D cells (500 cells/well) were plated in 24-well plates in culture medium containing 0.35% agar. The cells were treated with by 500 ng/ml Dox for 4 weeks. The top layer of T47D colonies was stained with p-iodonitrotetrazolium (1 mg/ml), and counted. Data are presented as mean±s.d. Three experiments were performed. P-values were calculated based on two-tailed student's t-test.

