
Figure 1. The α4 integrin—VCAM-1 interaction mediates direct macrophage-adipocyte interactions.
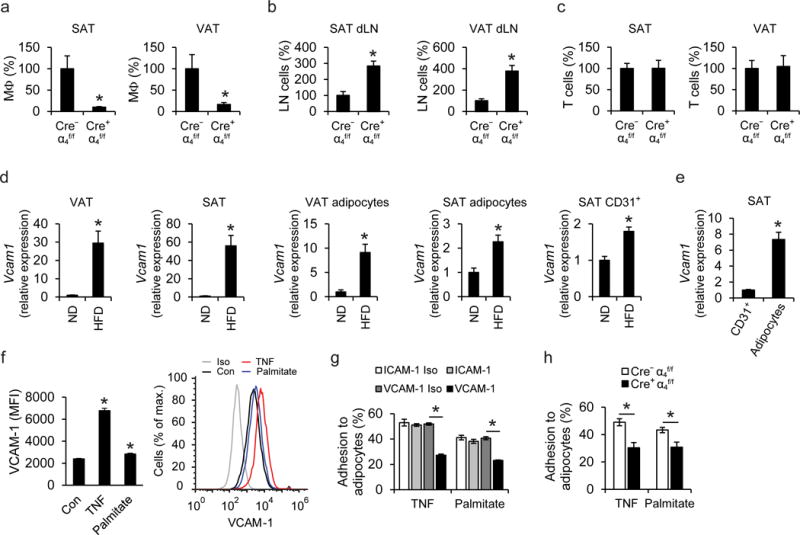
a–c) Adoptive transfer experiments; a 1:1 mixture of PKH26-red labeled Cre−α4f/f and PKH67-green labeled Cre+α4f/f cells (monocytes or splenic T cells) was simultaneously transferred into obese wild-type mice. The numbers of Cre−α4f/f and Cre+α4f/f macrophages (a) or T cells (c) accumulated in inguinal subcutaneous adipose tissue (SAT) or visceral adipose tissue (VAT) and the numbers of Cre−α4f/f and Cre+α4f/f monocytes/macrophages accumulated in the lymph nodes draining the SAT (SAT dLN) and lymph nodes draining the VAT (VAT dLN) (b) were analyzed by flow cytometry. Data (percentage of labeled cells in defined cells) are presented as relative to control. The percentage of labeled Cre−α4f/f cells in defined cells was set as 100% in each tissue; n=5 recipient mice in a,b and n=4 recipient mice in c; data in (b) are from one experiment, data in (a), (c) are representative of two experiments. d) Vcam1 mRNA expression was determined in VAT and SAT of lean mice, fed a normal diet (ND, n=8 mice) or obese mice (fed a HFD, n=10 mice), in mature adipocytes from VAT and SAT of lean (ND, n=6 mice) or obese mice (HFD, n=6 mice), and in CD31+ endothelial cells from SAT of lean (ND, n=5 mice) or obese mice (HFD, n=6 mice). 18S expression was used for normalization and Vcam1 expression of ND-fed mice was set as 1 in each case. Data are from one experiment (SAT endothelial cells) or representative of two experiments (VAT, SAT, VAT adipocytes, SAT adipocytes). (e) Comparison of Vcam1 mRNA expression between CD45−CD31+ endothelial cells and adipocytes from SAT of obese mice is shown. Vcam1 expression of endothelial cells was set as 1; n=6 mice; data are from one experiment. f) Primary mouse adipocytes were treated without (control; Con) or with TNF or palmitate. The surface expression of VCAM-1, expressed as Median Fluorescence Intensity (MFI) units, analyzed by flow cytometry, is shown (n=6 separate cell isolations; data are representative of two experiments). In the right panel, a representative flow cytometry plot depicting VCAM-1 expression of Control-, TNF-, or palmitate-treated adipocytes, as well as isotype control (Iso), is shown. g) Adhesion assay of bone marrow mononuclear cells (BMM) to TNF- or palmitate-pretreated 3T3-L1 adipocytes was performed in the presence of ICAM-1- or VCAM-1-blocking antibodies or respective isotype controls (ICAM-1 Iso or VCAM-1 Iso). The percentage of adherent cells is shown. Shown is one experiment performed in triplicate; representative of 3 experiments. h) Adhesion of BMM from Cre+α4f/f or Cre−α4f/f mice to TNF- or palmitate-pretreated 3T3-L1 adipocytes (data from separate BMM isolations from n=6 Cre+α4f/f mice and n=8 Cre−α4f/f mice; pooled from 3 experiments). The percentage of adherent cells is shown.
Data are presented as mean ± SEM. *P < 0.05. Mann-Whitney U-test in (a), (c), (d), (e), (f), Student’s t-test in (b), (g), (h).