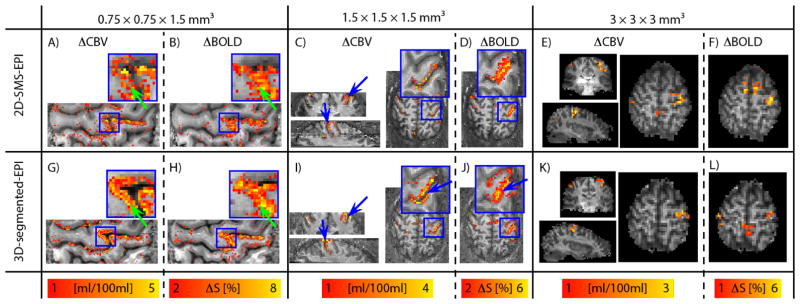
Fig. 4. Functional results across resolutions.
Functional activation results for 0.75 mm, 1.5 mm and 3 mm resolutions are shown for one subject in (A)–(F) for 3D-segmented-EPI and (G)–(L) for 2D-SMS, respectively. The depicted participant and the depicted slices are the same as shown in Fig. 2 (A)–(B). For the sake of comparison, functional maps of BOLD signal changes are shown next to the VASO results. Note that BOLD signal changes are acquired simultaneously with VASO, while 3D-segmented-EPI and 2D-SMS data are acquired in two separate experiments ≈ 14 min apart. Also note that the functional contrasts and the color bars are differently optimized across resolutions, but they are the same for 3D-segmented-EPI and 2D-SMS results. For low resolutions of 3 mm in (E)–(F) and (K)–(L), functional maps don’t show strong qualitative differences for contralateral M1. Independent of contrast and readout-strategy, the high tSNR values (Fig. 2) result in sensitivities well above the detection threshold in all cases. At 1.5 mm resolution, the higher specificity of CBV-sensitive fMRI starts to pay off. E.g. two sides of the central sulcus can be better separated with CBV-fMRI compared to BOLD (blue arrows in ((C)–(D) and (I)–(J)). At 0.75 mm resolution, layer-dependent activity features become visible in CBV-fMRI results (green arrows in (A) and (G)), while the BOLD results appear less specific (green arrows in (B) and (H)).

