FIG. 3.
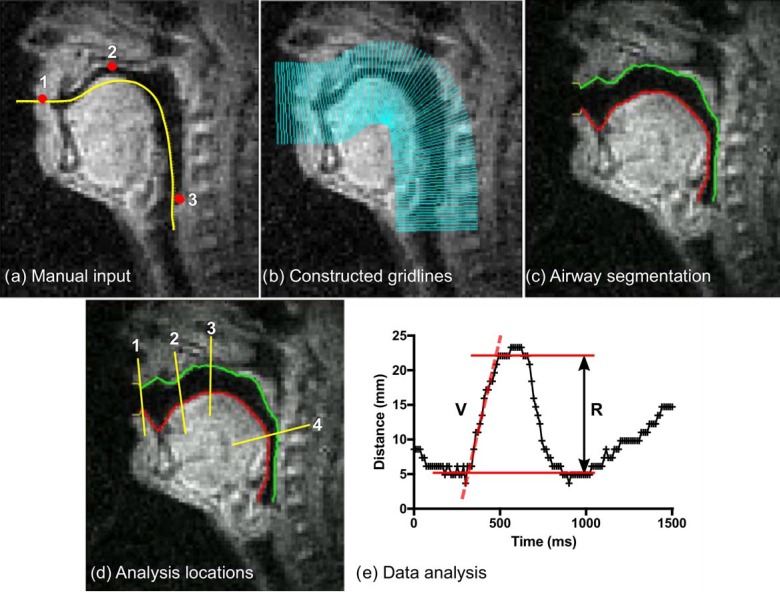
(Color online) Quantitative dynamic RT-MRI measures using the grid-based method. Panel (a) shows the manual input to the method. First, an approximate vocal tract centerline is drawn (yellow line). Three landmarks are positioned (dots) at (1) the lowest point of the upper lip, (2) the top of the palate, and (3) at the pharyngeal wall at the top of the larynx. Panel (b) shows the constructed analysis gridlines. Panel (c) shows the automatic airway boundary segmentation. Panel (d) shows gridlines chosen for further analysis of distance and velocity located (1) between the lips, (2) between the tongue tip and alveolar ridge, (3) between the tongue and top of the palate, and (4) between the tongue and pharyngeal wall. Panel (e) shows quantitative measures, in this example for the utterance aa-ii-aa at location 4 (pharyngeal wall—tongue). Velocity (V) is measured by manually selecting a time interval and fitting a straight line to the data using linear regression. Range (R) is quantified by manually selecting the time interval of interest and then taking the difference between the 10th and 90th percentile of distance values in that interval.

