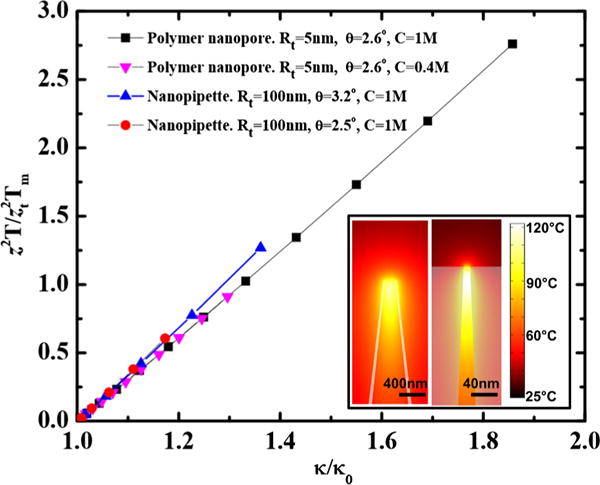
FIG. 3.

Collapse of simulation result of highest temperature vs normalized conductance for the nanopipette and nanopore with voltages ranging from 2V to 25V. Rt indicates tip radius, which varies by a factor of 20 from polymer nanopores to nanopipettes. C indicates molarity of KCl. Contour plots of the temperature near the tip of the nanopipette and polymer nanopore at 24V are shown in the inset. Room temperature is 25 °C.
