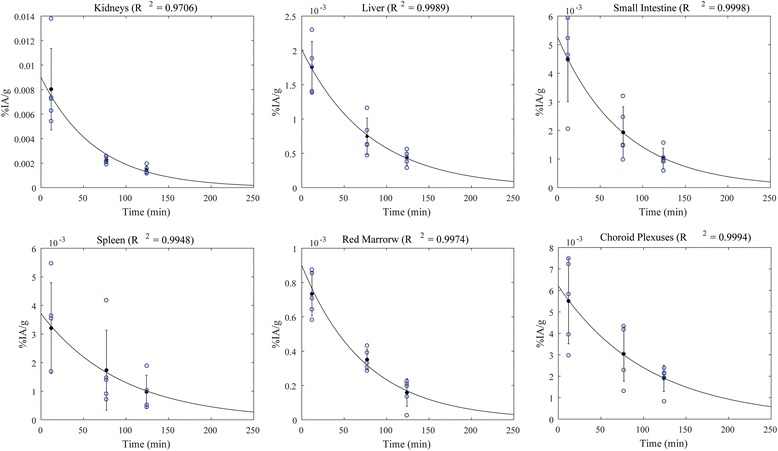
Fig. 3.

68Ga-NODAGA-RGDyK time-activity concentrations for some of the most irradiated organs. The organ activity was normalized to the injected activity and organ mass (%IA/g). Blue circles at each time point indicates the measurements for the five patients enrolled in this study. Solid lines represent the mono-exponential fits and error bars indicate ±SD. The coefficient of determination (R 2) of the fit is reported for each organ
