
Figure 2.
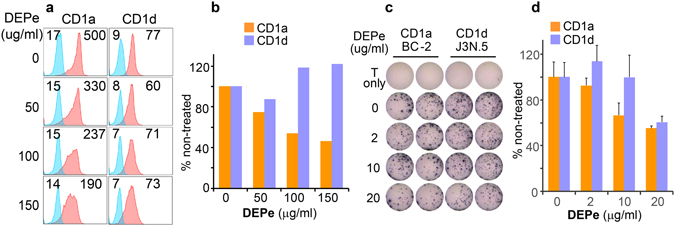
Inhibition of CD1a expression and T cell activation by DEPs. Expression of CD1a and CD1d proteins on DEP-exposed DCs and T cells responding to DEP-exposed DCs were similarly tested and shown as in Fig. 1. Mean fluorescence intensity (MFI) of CD1 staining was labeled by the histogram (a) and was also normalized to that of non-stained samples (b). T cell activation mediated by DEP-exposed DCs was tested by IFN-γ production and shown with an immunospot assay (d). Quantified immunospot results show certain inhibitory effect of DEP on the activation of CD1a-restricted BC-2 cells in a dose-dependent manner (e). Standard errors from technical replicates of each sample are shown. Data are from one experiment using cells from an independent donor. Two experiments were performed with similar results.