
Figure 4.
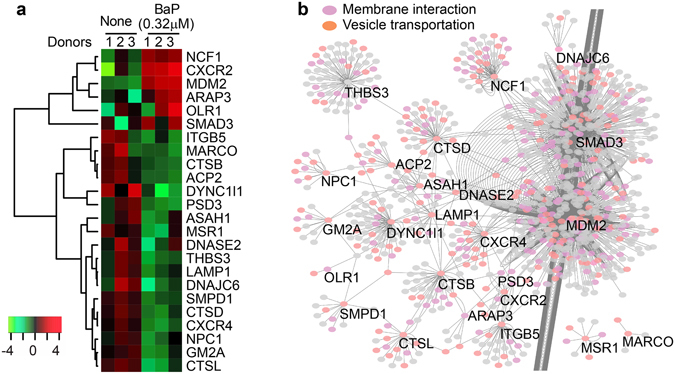
Gene expression and interaction of endocytic gene clusters. A heatmap shows the expression level of individual genes from endocytic clusters (a). The partner proteins interacting with these encoded proteins were predicted by searching against the protein interaction database BioGRID3.4 and visualized with Cytoscape. The result shows a putative interacting network highly relevant to membrane interactions and vesicle transportations (b). Each node represents a protein and each line represents an interaction.