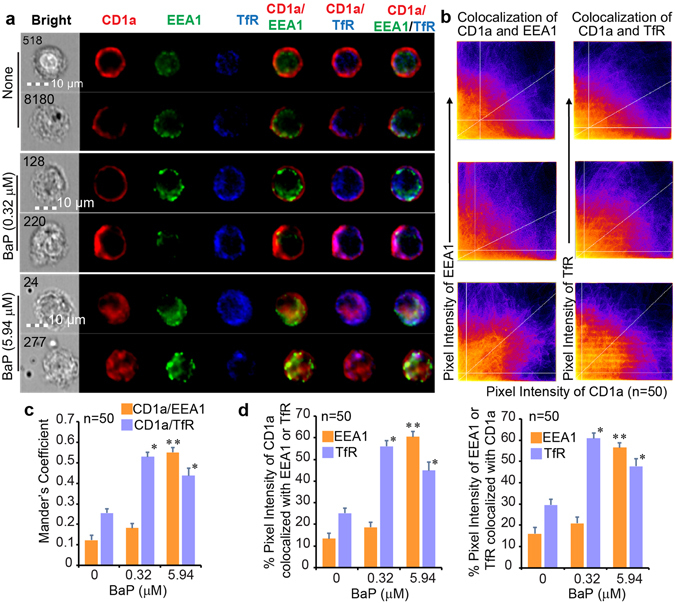
Figure 5.

The CD1a protein retained in early and recycling endosomes. According to the gating strategy in Supplemental Fig. 5, two cellular images in the gated HLA-DR+CD11c+CD1a+EEA1+TfR+ population from each BaP-exposed condition are shown together with cell identities (numbers) and size bars (a). Fifty cells with strong co-stain and subcellular localization of CD1a, EEA1, and TfR proteins were extracted from the gated DC population from each of three BaP exposure conditions (none, 0.32 μM, and 5.94 μM), as exemplified in Supplemental Fig. 5b. Each cell image was manually input into ImageJ-Fiji and analyzed for the co-localization between CD1a and EEA1 proteins or between CD1a and TfR proteins. The co-localization of pixel intensity between different channels is first visualized with scatterplots (b), in which the horizontal and vertical lines represent Costes’s thresholds and the diagonal lines represent the ratio of overall pixel intensity between two channels. Moreover, co-localized areas were quantified with the Mander’s coefficient between CD1a and EEA1 proteins, and between CD1a and TfR proteins. Each column represents an averaged calculation of 50 cell images extracted from each of three BaP exposure conditions for one pair of co-localized proteins (c). Finally, the percentage of co-localized pixel intensity is also calculated. Similarly, each column represents an averaged calculation of multiple cell images (n = 50) from each BaP exposure condition for the annotated pair of co-localized proteins (d). Statistical significance (n = 50, p < 0.001) was obtained with Student’s t-tests in comparison to the non-exposed group (*) and lower exposure group (**) with indicated standard errors. Data are from one experiment using cells from an independent donor. Two experiments were performed with similar results.
