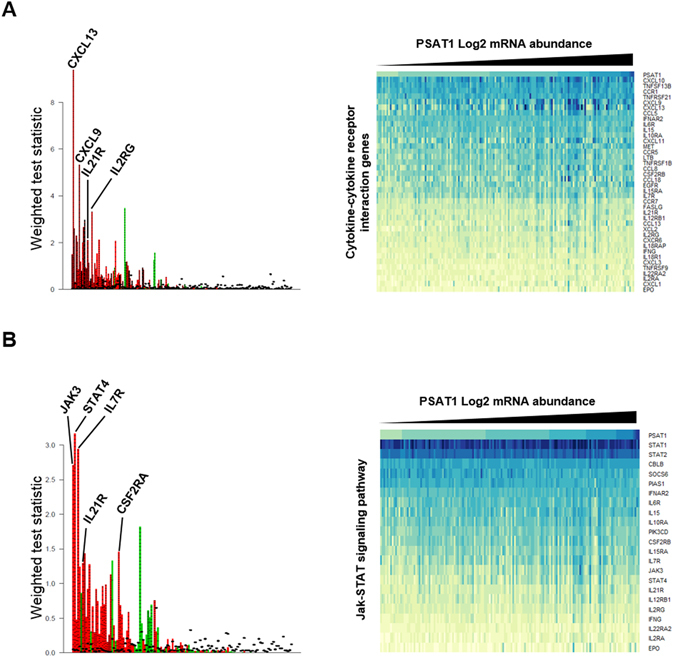
Figure 3.

PSAT1 expression associated genes in the gene expression dataset. The 155 tumors in the Affymetrix cohort were stratified according to PSAT1 expression. All genes were annotated for KEGG terms and Global test was performed to assess which terms were associated to PSAT1 expression. Panel A and B display the top 2 KEGG pathways associated to PSAT1: Cytokine-cytokine receptor interaction (A) and Jak-STAT signaling pathway (B). Bar charts (left) represent enriched genes in each pathway, with red and green columns representing the association to high and low expression of PSAT1, respectively. Heatmaps of most significantly enriched genes in each pathway (enrichment statistic P < 0.01; genes are ordered based on decreasing average expression) in relation to PSAT1 expression are also shown (right).
