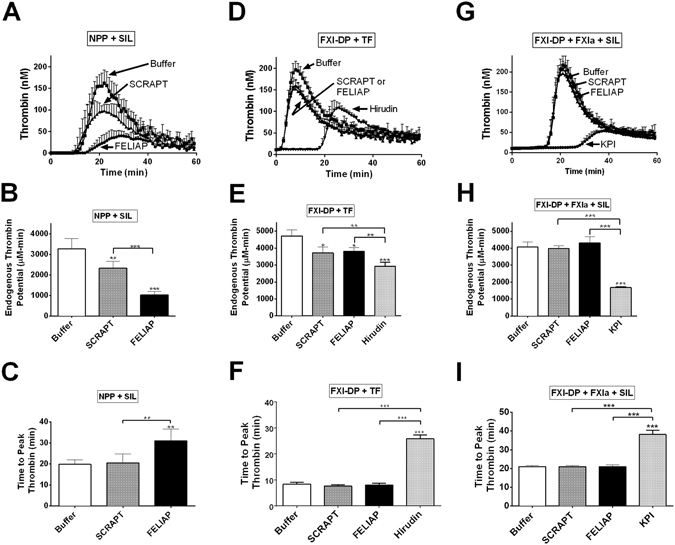
Figure 5.

Inhibition of thrombin generation by FELIAP. Thrombin generation assays (TGA) were conducted in 3 different ways: in recalcified human normal pooled plasma (NPP) using micronized silica (SIL) for contact activation as the initiator (NPP + SIL, panels A-C); in FXI-depleted plasma (FXI-DP) using tissue factor for extrinsic pathway activation as the initiator (FXI-DP + TF, panels D-F); and following 0.25 nM FXIa pre-incubation with Buffer, 1 µM SCRAPT, or 1 µM FELIAP, in FXI-DP activated with micronized silica (FXI-DP + FXIa + SIL). Thrombin concentration was determined fluorescently every minute for 60 minutes in each case. (A) TGA progress curves (mean ± SD (n = 6) with addition of agents (Buffer, 30 μM FELIAP, or 30 μM SCRAPT) as indicated by labels and arrows. Upwards error bars are shown. (D) As in A, but n = 5, and with additional assays including 0.2 µM recombinant hirudin variant 3 (Hirudin). (G) FELIAP, SCRAPT or KPI was pre-incubated with FXIa (1 µM: 0.25 mM inhibitor: enzyme ratio) and then diluted into FXI-DP activated with micronized silica for TGA. Progress curves (mean ± SD (n = 5)) are shown. Each set of TGA progress curves (A,D,G) are quantified with respect to endogenous thrombin potential (the area under the thrombogram curve) (B,E,H) and time to peak thrombin (C,F,I) in panel columns. Bar graphs are derived from analysis of individual thrombogram curves corresponding to plasma supplementation with Buffer (white), SCRAPT (grey), FELIAP (black), or, in some reactions KPI or Hirudin (light grey). Symbols (above the error bars) indicate statistically significant differences from Buffer reactions, while symbols above the horizontal bar indicate statistically significant differences between SCRAPT- and FELIAP-supplemented and other reactions: p < 0.001, *; *p < 0.001, ***.
