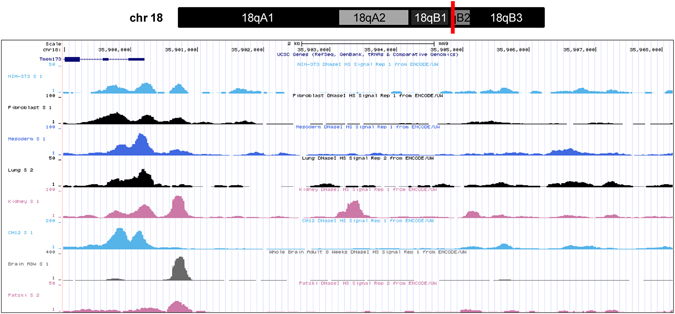
Figure 1.

DNase I hypersensitive sites in 5′ upstream of the mSTING gene by ENCODE. Part of the chromosome 18 structure was shown on the top of diagram and the mSTING gene (NC_000084.6) location was marked by red line. The 5′-flanking region of the mSTING gene (chr18:35, 899, 540–35, 904, 129, 4590 nt) was analyzed for DNase I hypersensitive sites in several murine cell lines and tissues including NIH3T3 cells by ENCODE (http://genome.ucsc.edu/). As the bottom of figure shown by UCSC Genome Browser on Mouse July 2007 (NCBI37/mm9) Assembly, the peaks of DHS appeared around TSS of the mSTING gene.
