Figure 3.

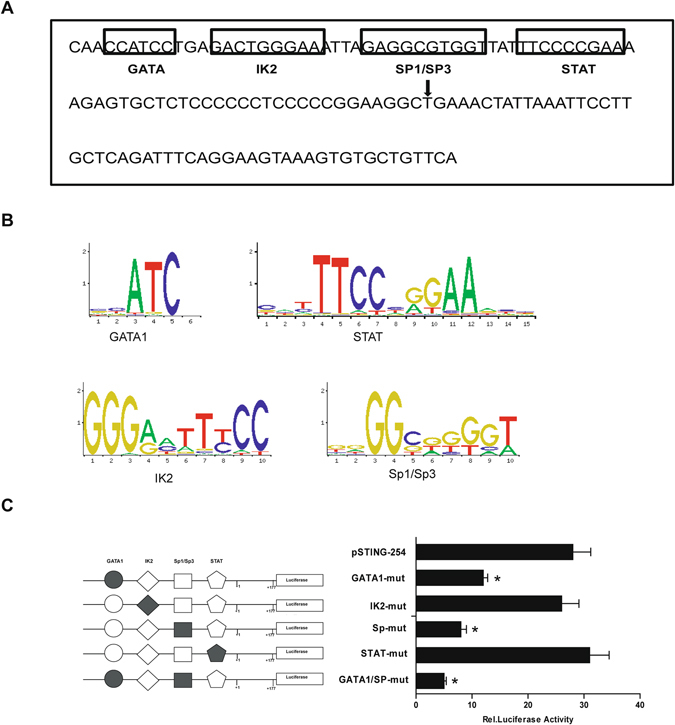
Prediction of transcription factor binding sites and mutation analysis of the mSTING minimal promoter. (A) A schematic representation of the putative binding sites for DNA-binding proteins in the proximal promoter of the mSTING gene. The 129 nt DNA sequence (from −77 to +52) was analyzed with TFSEARCH softwares. The putative transcription factor binding sites were outlined with black box, and the names of the transcription were annotated. The transcription start site (TSS) was marked by black arrow. (B) Conserved base sequence of GATA1, IK2, Sp1/Sp3 or STAT binding site. The base size presented the binding affinity coefficient of transcription factor and promoter. (C) Mutation analysis of the mSTING minimal promoter. The left: Binding sites for GATA1, IK2, Sp1/Sp3 and STAT were indicated with open different shapes. Mutations were shown in bold above the histogram. The right: The relative luciferase activities derived from mutational pSTING-254. The site-special mutagenized plasmids were cotransfected with pRL-TK into NIH3T3 cells and lucifarase assays were performed. The level of firefly luciferase activities was normalized to the Renilla luciferase activity. Each bar represented the mean ± SD of three independent experiments. (n = 3, *p < 0.05 vs. pSTING-254).
